Urban flood modelling using geo-social intelligence
Citation: K. Yang, K. Michael, R. Abbas and T. Holderness, "Urban flood modelling using geo-social intelligence," 2017 IEEE International Symposium on Technology and Society (ISTAS), Sydney, NSW, Australia, 2017, pp. 1-9, doi: 10.1109/ISTAS.2017.8319086.
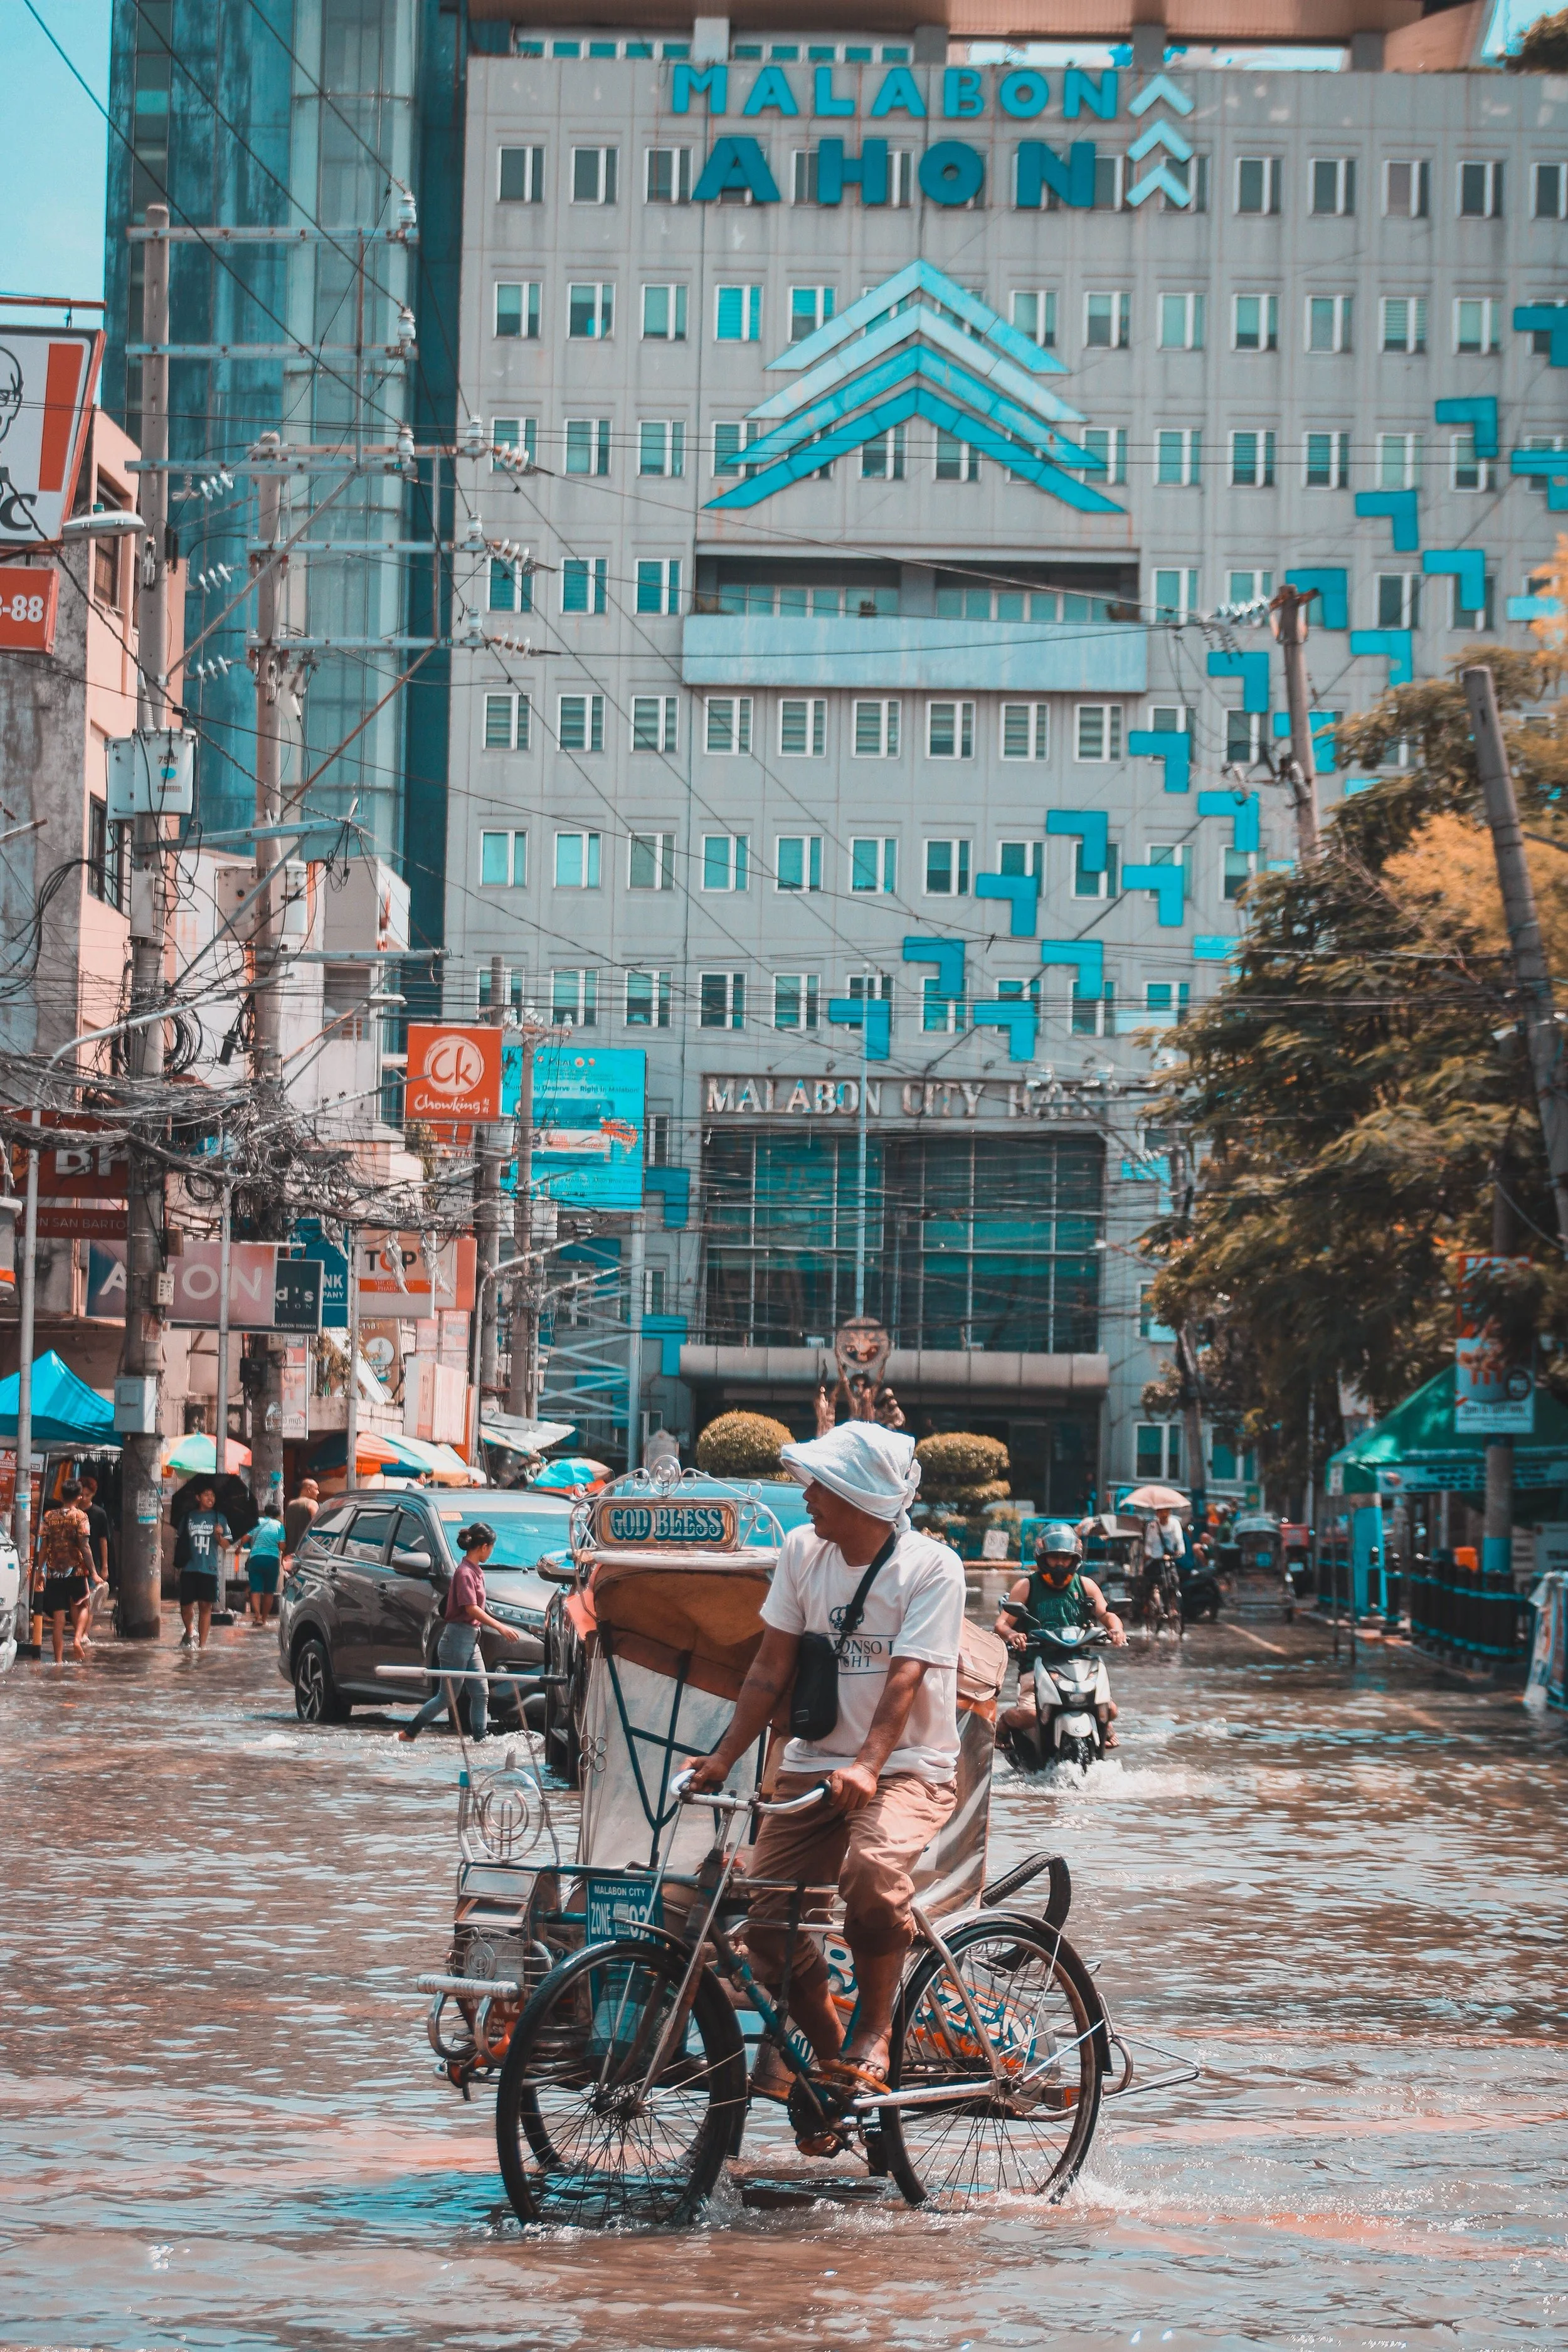
Image by Tear Cordez
Abstract
Social media is not only a way to share information among a group of people but also an emerging source of rich primary data that can be crowdsourced for good. The primary function of social media is to allow people to network near real-time, yet the repository of amassed data can also be applied to decision support systems in response to extreme weather events. In this paper, Twitter is used to crowdsource information about several monsoon periods that caused flooding in the megacity of Jakarta, Indonesia. Tweets from two previous monsoons related to flooding were collected and analysed using the hashtag # “banjir”. By analysing the relationship between the tweets and the flood events, this study aims to create “trigger metrics” of flooding based on Twitter activity. Such trigger metrics have the advantage of being able to provide a situational overview of flood conditions in near real-time, as opposed to formal government flood maps that are produced on a six to twelve hourly schedule alone. The aim is to provide continuous intelligence, rather than make decisions on outdated data gathered between extended discrete intervals.
SECTION I.
Introduction
The overall aim of the PETAJakarta.org project is to enhance capacity to better understand and promote the resilience of cities to both extreme weather events due to climate change and to long-term infrastructure transformation with the process of climate adaptation. To understand the full potential of Twitter as a real-time indicator for flooding, this research aims to quantify the temporal relationship between tweets related to flooding, and flood events in the city of Jakarta, Indonesia. Principally the project uses a statistical approach to investigate a time series of tweets related to flooding over specific monsoon periods, to determine whether the number of tweets is proportionally relational to the extent of flooding in the city at that point in time. It is hoped that such research can contribute to a wider understanding of the potential of social media to act as a real time crowdsourcing tool during extreme weather events. In this study, the focus is on the demonstration of the relationship between Twitter activity and flood events using statistical means. Past Twitter data and the real observed flooding events are used as the basis for modelling the urban flooding event in its totality.
A. Research Objectives
This research is divided into a series of data experiments that will use statistical tests to examine different aspects of the corpus of Tweet data that was collected. The research is exploratory: To advance the understanding of the relationship between flood events and Twitter activity in Jakarta, this study will quantify the relationship by addressing a spatiotemporal comparison of historical tweets with official flood data from the 2012–2013 and 2013–2014 monsoon seasons. The study relies on three stages of enquiry, each of which corresponds to a specific experiment.
As such, there are distinct objectives for each of the three stages:
Summary Statistics: To provide an overview of the data
Time Series Plot: To explore the relationship between Twitter activity and flood events
To test whether there is a relationship between number of Tweets and number of flooded areas over time
The first two stages can be regarded as the pre-processing stages in the processes of analysis and modelling, which are attempting to summate all data, and gain a preliminary understanding of flood events and Twitter activities. Stage three seeks to provide a comprehensive analysis of data and relationships between flooding events and Twitter activities.
SECTION II.
Background
A. Participatory Sensing
The problems of the distribution and acquisition of crowdsourced information have been addressed by emerging technologies. As more and more mobile devices are equipped with GPS sensors, computers and Internet connections with advanced server- and client-side technologies, users can actively participate and be satisfied with these applications and location services. From a distinct perspective, the user is becoming a complex stakeholder given the dual role held as producer and consumer. Prosumers have an important role to play in society. Web 2.0 has enabled and encouraged citizen-generated reporting useful to problems requiring large-scale coordination. Participation by citizens in once “government-only” problem solving arenas is a completely new paradigm shift that has been enabled by emerging technologies [i]. The act is known as “participatory sensing” [ii].
Citizens wishing to engage in contributing vital flood knowledge using Twitter do not require previous expertise. They simply go about their business as usual and may additionally opt to include particular hashtags that are encouraged for ease of near real-time data mining. Goodchild, in 2007 [iii], named this practice as “Citizens as Sensors”, where Volunteered Geographic Information is created, gathered, and spread by those individuals or groups who can use Web 2.0. The interactive networked and shared model of “People as Sensors” information is supplied for free and entirely voluntary. Haklay [iv] calls this new social web mapping application the evolution of the Geo-Web.
B. Location Based Social Networking
Social Networks are an important part of this development, combining new information with communication tools and applications, attracting hundreds of millions of users. Boyd and Ellison [v] point to the term Social Network Sites (S N S), on behalf of individuals who construct an online profile communicating with other users, in order to share their common ideas, activities, events interests and backgrounds. Furthermore, Location Based Social Networks improve existing social networks, adding space with location services [vi], [vii]. For example, users upload geo-tagged photographs from Flickr, checking in by a venue with Foursquare or commenting on a local event on Twitter. These are all digital touchpoints that leave behind digital traces. Geo-information drawn from the Location Based Social Network (LBSN) is included under the umbrella of volunteered geographic information, although sometimes users themselves do not realise they are leaving behind these digital breadcrumbs [viii]. Harvey [ix] argues that a preferable term would be “contributed” data, since people do not consciously volunteer their data, but use the platforms to generate it for their particular purpose. When data generated for one purpose is used for another purpose, no matter how honorable the aim, there are privacy and ethical implications that come to the fore. While outside the scope of this project, the utilitarian approach has been espoused here- for the sake of the common good this data can help aid Jakarta's response to flooding.
C. Twitter Messages and Location-Based Data
On the social media platform Twitter, users can publish short status messages of 140 characters at most and may attach photos and videos. The act of sending a message using Twitter is known as “tweeting”. These status updates may contain syntax such as hashtags (#), handles (©) which act as identifiers, and refer to a key word or jargon relevant to the given topic the users are discussing or commenting about. Users have the option of “following” other users, or being “followed” themselves. One can tweet or retweet or even favourite someone else's tweets. Additionally, one user can send direct messages to another, and any user can search the entire corpus of tweets for specific information.
According to Twitter, an average of 500 million tweets are written each day among about 270 million monthly active users. With the permission of the user, each tweet can contain geo-location information from the GPS sensor within the users' device. These location structures allow users to exchange details about their location as an important interaction via the Internet. Location Based Social Networks connect our physical world and network services containing three layers of information: user layer, location layer and content layer [4]. Therefore, a status update which users publish using Twitter represents a spacing signal in a semantic information layer. After registration in Twitter, all tweets can be recorded in real-time through the streaming API. The Twitter API prompts for allowance filtering of selected tweets or a choice to access only those tweets obtained by geo-referenced Twitter messages in a bounding box, often referred to as a minimum bounding rectangle (MBR). From this spatiotemporal information layer, we can see that a byproduct of individual social interaction may drive research in spacing structures. It will be particularly interesting to view the emergence of the use of Twitter for research purposes, and specifically disaster management, in this case flooding. It is important to note, given the nature of this project, that the review will draw on interdisciplinary work.
SECTION III.
Methodology
A. Study Area
The Greater Jakarta metropolitan area is home to an estimated 28 million residents, and suffers from severe flood events during annual monsoon rains. Localized flooding is a function of infrastructure failure, meaning that different areas of the city may flood at a given time, and that flooding severity may increase rapidly depending on infrastructure failure, and relating cascading failures of interconnected infrastructure. Detecting and gathering detailed reporting about the situation is a first priority for the government in aiding its citizens. The location for the study was chosen not only because of its geographic topology and monsoonal weather but because the penetration of Twitter users in Jakarta, Indonesia is high.
B. Twitter Data Grant Filtering
Twitter data was obtained for two particular monsoons, and was filtered by relevant keywords in Bahasa Indonesian or English. For instance, keywords such as ‘#banjir’, ‘#flood’, ‘genangan’, ‘pool’, ‘terendam’ and ‘submerged’, were supplemented with observational data of Jakarta flooding events as recorded by the Indonesian Government. The latter contained data such as time, coordinates and count, all of which were recorded in numerical form.
C. Data Collection
Two datasets were used in this research, as described in the following sections. To aid organization and analysis, both datasets were stored as tables within a PostgreSQL relational database, with the PostGIS extension used to support geographical analysis as required.
1) Dataset a (Polygons of Flood Affected Areas)
The first dataset of Jakarta Flooding events (areas) contained data provided by the Indonesian Government, namely the agency BPBD DKI that maintains archival data of all disasters that take place in Jakarta. This included an:
Archive of flood events 2013–2014 monsoon season
The flood areas provided were at the ‘RW’ municipal ‘neighbourhood’ scale. At this scale, it is probable that the entire area is designated as “not flooded”, but in reality, the area has been designated as “flood affected” by the Jakartan government, indicating the flood waters have entered the neighbourhood and residents are flood affected. This data is used by the Jakarta government for planning response to flood events, and a finer-grained resolution of flood information is not currently available in Jakarta. Only the ‘RW’ areas, which were flooded for the given time period, are shown.
Generally, the data shows the ‘RW’ areas which have been marked as affected by flooding over a 12 hour period up to the specified point in time (normally either 06:00 or 18:00), although this frequency may increase and decrease depending on conditions. Therefore, a record marked as 06:00 shows the areas marked as affected by flooding from 18:00 on the previous day.
2) Dataset B-Tweets
The second database contained two tables: “floods 2012 2013” and “floods 2013 2014”. The corresponding tweet tables contained tweets at a point in time and their location meta-data, if available. Tweets were selected if they included geo-location data and were either within the following bounding box:
bounding_box:[106.5894 −6.4354 107.0782 −5.9029]; or
the user's bio-information contained the word ‘Jakarta’ (bio_location_contains: “Jakarta”).
Thus, the archive contains both spatial and a-spatial tweets.
Tweets in the database were captured within the following UTC Time Frames:
00:00 30/10/2012 − 00:00 02/3/2013 (Monsoon 2012–2013)
00:00 30/10/2013 − 00:00 02/3/2014 (Monsoon 2013–2014)
D. Data Analysis
The data analysis techniques heavily relied upon statistical analysis, including descriptive statistics, time series representations, clustering techniques, and data correlations, tabular results, and histograms. Scatter plots were specifically employed to show patterns and trends that might gleam specific insight into links between the number of tweets with the #banjir and declared flood management zones. The tweet was the unit of analysis at which this study was conducted, including the metadata of that tweet which might have also included location x and y coordinates and time stamps. Outside the scope of this paper, though implemented, were the confirmed reports (i.e. mapping) of tweets on a visual GIS representation. These confirmed reports were used on a dashboard at the BPBD emergency operation centre to make decisions (Exhibit 1).
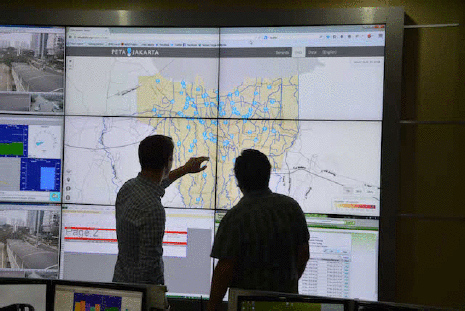
Exhibit 1 PetaJakarta app at bpbd‘s jakarta incident control room. courtesy of tomas holderness
SECTION IV.
Experiments
The analysis is divided into a series of stages that will use statistical tests to examine different aspects of the data. These stages are detailed below in terms of the specific calculations or series of tasks.
A. Summary Statistics
Objective: To provide an overview of the data
Twitter data:
Calculate the number of tweets for both monsoon seasons
Calculate the number of tweets with geolocation for both monsoon seasons
Calculate the number of original users both monsoon season
Plot a histogram of the number of tweets per user for each monsoon
Flood data:
Calculate the number of flood events (flooded areas) for each monsoon
B. Time Series Plot
Objective: To explore the relationship between Twitter activity and flood events
Twitter and flood data:
Plot the number of tweets in 12 hours over a time series
On the same plot (time series), add the number of flooded areas (RWs) per 12 hours
C. Relationship Between Twitter Activity and Flood Events
Objective: To test whether there is a relationship between number of tweets and number of flooded areas over time
Null and Alternative Hypotheses:
H0: There will be no statistically significant relationship between the number of flooded areas and the number of tweets at the 95% confidence level.
H1: There will be a statistically significant relationship between the number of flooded areas (independent variable) and the number of tweets (dependent variable) at the 95% confidence level.
Twitter and flood data:
Calculate the number of flooded areas and the number of tweets at six-hourly intervals for both of the time series.
Create a scatter plot of the number of flooded areas/number of tweets
Calculate the Spearman's Rank Correlation Coefficient for this data with the number of tweets as the dependent variable at the 95% confidence level [x].
If the trend appears linear, calculate simple linear regression for the relationship [10].
SECTION V.
Results
A. Experiment One
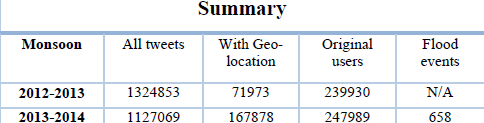
Table I. Summary statistics
Based on the data from Twitter users in Jakarta, it can be seen that not all tweets contained geo-location metadata. Table 1 shows the count of all tweets, tweets with geolocation metadata and corresponding Twitter users for each monsoon season. It additionally displays the number of flood events as measured by government data for the 2013–2014 monsoon. Please note that government “flood event” data was not available for the 2012–2013 monsoon.
As Table 1 shows, there were 239,930 individual Twitter users but 1,324,853 tweets matching the above described filters were tweeted out during the monsoon season 2012–2013. For the 2013–2014 period, there were 247,989 users and 1,127,069 tweets. This indicates that a large number of Twitter users tweeted more than once in both monsoon periods. To further illustrate this point, Figures 1(a) and 1(b) provide histograms for the two monsoons in order to show the density distributions or counts of tweets per user.
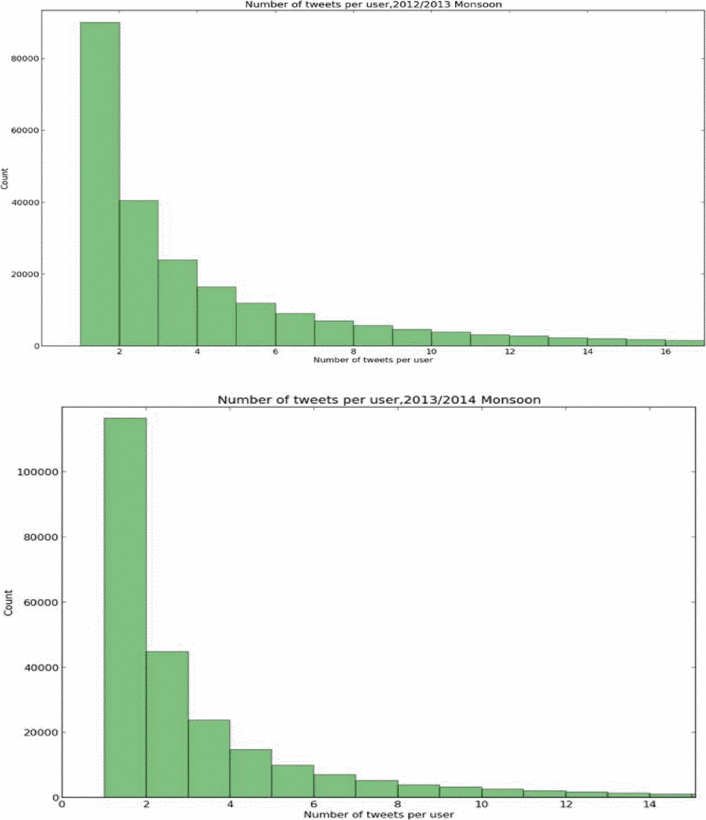
Figure 1 (a) and 1(b) tweets per user-2013-2014 monsoon.
The consistency, in terms of tweets per user, for both monsoon periods is evident. The two figures demonstrate that the majority of users tweeted once during flooding, about 90,000 in monsoon 2012–2013 and 110,000 in monsoon 2013–2014. Similarly, both histograms illustrate that users who tweeted twice during flooding in Jakarta are second in terms of count, and those who tweeted three times are third in terms of count, and so on. In summary, the graphs show that the counts of tweets per user tend to decline with the growth of the number of tweets per user. This evidence can explain why there were 239,930 original Twitter users in the monsoon period 2012–2013, whereas 1,324,853 tweets were tweeted. Likewise, for the monsoon period 2013–2014, there were 247,989 users while the tweets count was 1,127,069.
B. Experiment Two
In this stage, the relationship between Twitter activity and flood events was explored by plotting the numbers of both Twitter activity and of flood events over the time series of the 2013–2014 monsoon season. As mentioned previously, formal government data on locations of flooding for the 2012–2013 monsoon was not available for comparison. The fluctuations in the tweets and flood events over time are displayed visually on the same plot, so as to determine if there is a relationship between these two fluctuations. Counts of both Twitter activity and flood events were calculated at 12-hourly intervals using a Python script. A function was developed to transform the original data with 1 hour time interval to the data with 12 hourly time interval. In Figure 2, the green line represents Twitter activity which refers to the number of tweets, while the blue bars represent the flood events indicating the number of flooded areas.
Figure 2 demonstrates that the fluctuation in Twitter activity is similar to changes in the number of flood events. Hence, there is an evident correlation between these two variables. Experiment three will determine whether there is in fact a statistical correlation. Additionally, as Figure 2 shows, the fluctuation is not always synchronous with the change of the flood events, which will be analysed in greater depth in experiment three.
C. Experiment Three
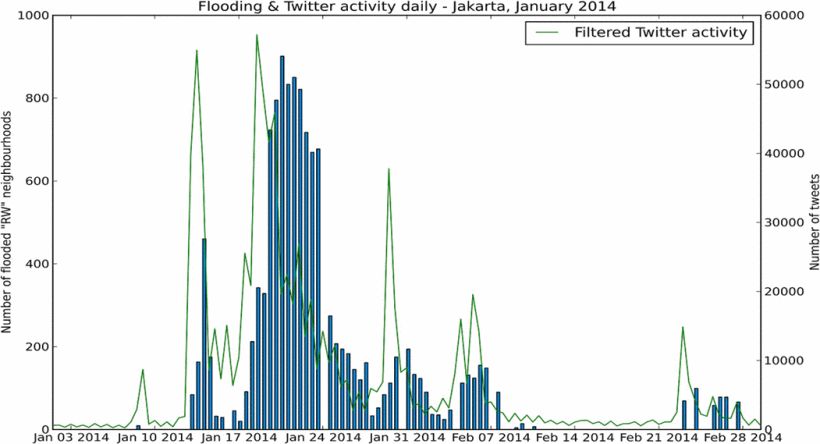
Figure 2.
Plotting in 24-hour-time twitter activity by number of flood areas
The purpose of this experiment was to test whether there is a statistical relationship between the number of tweets and the number of flooded areas over time. Consequently, the null hypothesis is that there will be no statistically significant relationship between the number of flooded areas and number of tweets at the 95% confidence level, and the alternative hypothesis is that there will be a statistically significant relationship between the number of flooded areas (independent variable) and the number of tweets (dependent variable) at 95% confidence level.
The Spearman Rank Correlation coefficient plays a significant role in geographic information systems (GIS), since it is a nonparametric measure of the relationship between two sets of ordinal (ranked) values, which will be applied in this relationship test between the tweets and flood areas. The equation for the Spearman Rank Correlation coefficient is:
ρ=1−6∑ d2in(n2−1).
Where ρ ( i.e r s ) is the Spearman rank correlation coefficient, di is the difference in ranking for each item which is: di=xi−yi, and n is the number of items ranked.
To reduce potential bias for averaging, this experiment required that the data be transformed into 6-hourly time interval data to calculate the coefficient. The 6-hourly interval is the finest temporal-granularity available in the flood events data from the Jakarta government. Thus, counts of tweets were resampled to a 6-hourly level.
A scatter plot of the number of flooded areas against the number of tweets was created, in order to provide a visual representation of the two variables. As Figure 3 shows, the y-axis refers to the number of tweets and x-axis signifies the number of flooded areas.
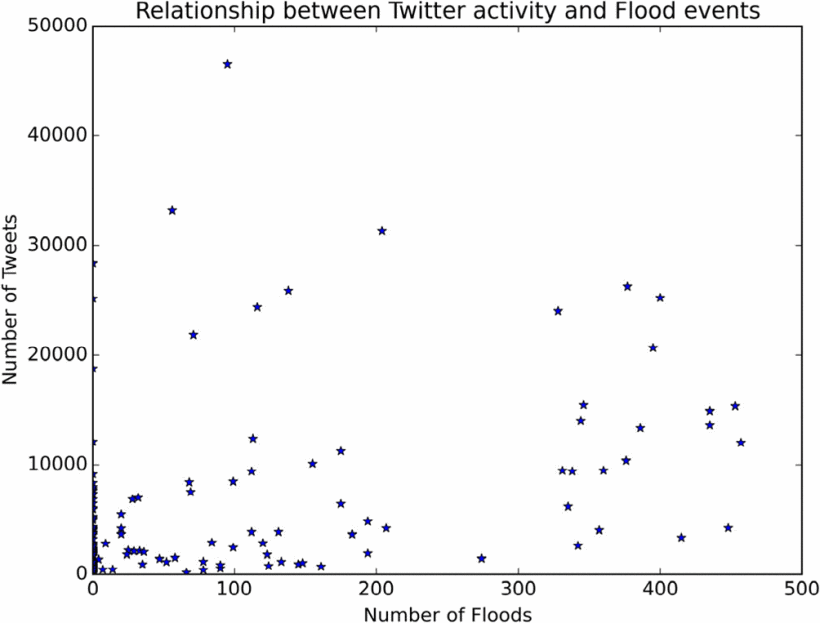
Figure 3. Scatter plot of the number of flooded areas/number of tweets
Figure 3 also demonstrates a significant number of points on the y-axis, which means that these areas were not affected by flooding, while at the same time a large number of tweets are recorded. Those points refer to noise in this instance. Intuitively, if there is a strong linear regression between these two variables, the scatter plot would reveal a linear trend. Although a strong linear regression cannot be seen graphically in Figure 3, this observation will be tested further using mathematical/statistical calculations using the SPSS program in the next experiment.
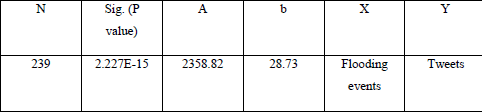
Table II. Significance testing
The result of Spearman Rank Correlation Coefficient between number of tweets and number of flooded RW areas over the time series, rho, was ‘0.54’ in the program, which is consistent with the result of rho as calculated by the SPSS package. Table 3 displays the results for the Spearman Rank Correlation Coefficient. Significantly, the two calculation processes of the Spearman Rank Correlation Coefficient are at a 95% confidence level. Therefore, based on this result, the null Hypothesis H0 is rejected: that there is no statistically significant relationship between the number of flooded areas and the number of tweets at the 95% confidence level, and the alternative Hypothesis H1 is accepted. Furthermore, the linear regression of numbers of flooded areas and tweets was tested using SPSS. The results related to significance (P-value), a and b are shown in Table II.
Sig. (P value): 2.227E-15<<0.05 which can prove that the established regression equation of statistical significance, namely the linear relationship between independent variable and dependent variable
Based on the results in Table 2, the linear regression equation of tweets and flooded areas is presented is:
Linear regression equation: Y=2358.82 + 28.73*X
In addition, to provide a visual representation of the linear regression, the linear trend based on the equation in SPSS is shown as Figure 4.
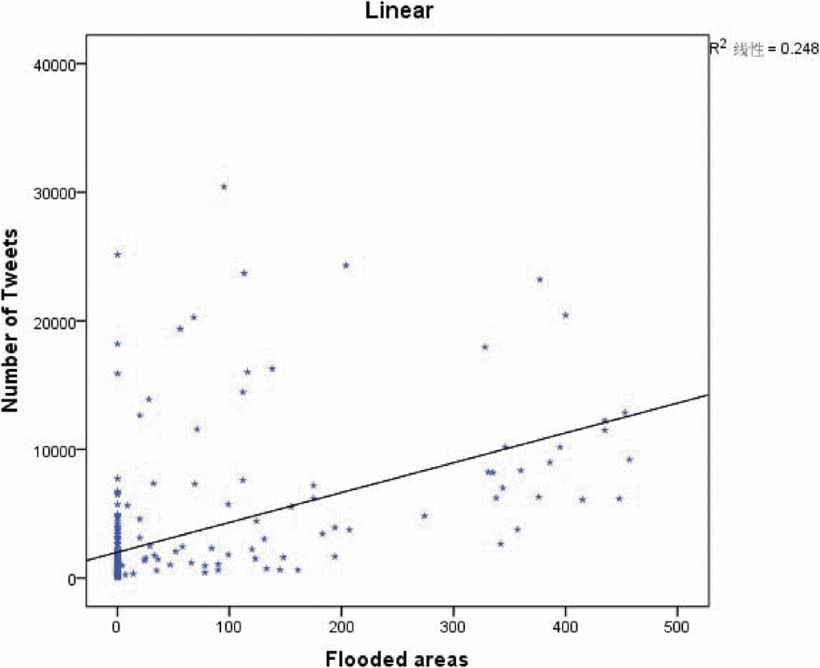
Figure 4. Linear regression. Relationship between tweets and flooded areas
SECTION VI.
Discussion
The purpose of this section is to analyse the relationship between the flood events and Twitter activity using the data itself in addition to the real-world situations, so as to provide greater insights into the relationship between the flooded areas and tweets based on the results of the experiments presented above. The analysis process involves dividing the six-hourly histogram into 3 parts, labelled as ‘°1’ to ‘°3’, by the two yellow lines shown in Figure 5, which symbolise the preliminary, middle and end phases of flooding events.
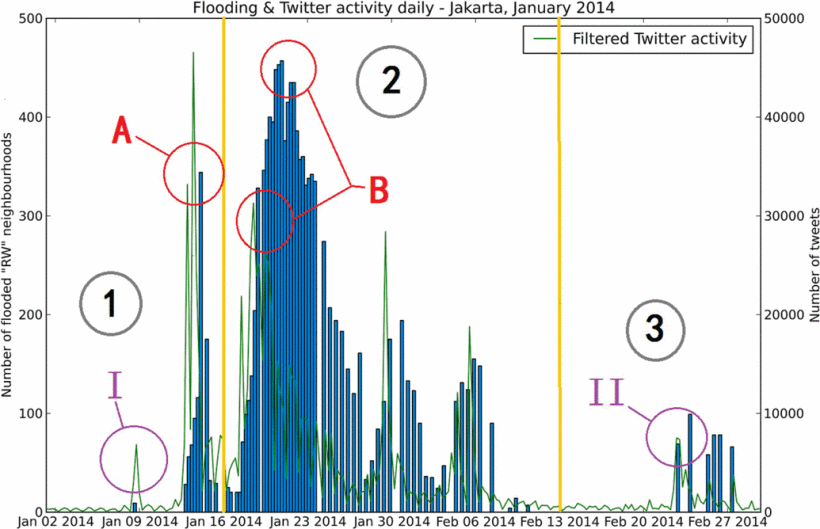
Figure 5. Analysis illustration of relation between flooding & tweets
Figure 5 illustrates that the general fluctuation of tweets is not always synchronous with the change of the flood events except at a few time intervals. The highest number of tweets, close to 48,000, occurred in the preliminary phase instead of the middle phase when the greatest number of flood events had occurred, peaking at 470, as recorded in the government data. Additionally, it can be seen, when referring to the two sites marked in red ‘A’ and ‘B’, that the number of tweets declines at the same point at which the flooded areas increase.
To fully understand the phenomenon mentioned above, future work should compare with evidence of observational data from the real situation in Jakarta. For instance, at the time of the flooding in Jakarta:
People are unable to utilise mobile phones given the need to flee the severely flooded sites.
Due to power failures, mobile phones cannot be charged in certain areas where civic infrastructures are affected by flooding.
A. Benefits of Twitter in Floods
Based on these findings, Twitter activity, notably the intelligence gained from individuals responding to flood events using this medium, provides a number of benefits.
1) Critical Value
Citizens' Twitter activity relating to floods is dependent on the flooding events. One would generally expect that the more severe the flooding events, the more intensive or frequent the Twitter activity. The observed trend in this study, however, is that while there was an increased response at the beginning of every monsoon period, the trend altered and Twitter activity decreased with the intensification of the flooding, as is demonstrated by the red circles corresponding to the letter ‘B’ in Figure 5. That is, Twitter activity decreased intensively while the flooded events increased sharply. This is similarly the case for flooding events marked by the letter ‘A’ in Figure 5, whereby tweets decreased with the increase of flooding events. Therefore, the critical scale of flooding which can change the trend is presented here based on the reality. This means that the Twitter activity will decrease at a certain scale, which is termed ‘critical value’, of flooding with the growth of the scale of flooding. It is reasonable to state that citizens will forgo tweeting when the flooding scale is too high over the critical value. In this case, the number of tweets declined sharply.
Referring to the data, two variables are of importance: the number of tweets (six-hourly) which is the dependent variable, and number of flooding events (six-hourly) which is the independent variable. Table 5 (a) and (b) offers fragments of data (six-hourly) in which the left column signifies the numbers of tweets and the right column records the numbers of flood events.
In Table 5(a), the highlighted fields indicate that the number of tweets increased to 46,545 when the number of flooding events was 95 (and increasing). After the peak point in flooding events (344), the number of tweets decreased dramatically to 14,001. Comparably, in Table 5(b), the number of tweets increased to the highest point of 31,290, after which the figures declined with the increase in flooding events (328). Furthermore, when the number of flooded areas reached a peak of 457, the number of tweets dropped to 12,031. While this does not provide the accurate critical value, it does illustrate the real-world situation, explaining the unexpected points that make the fluctuation of the tweets asynchronous with changes in the flood events.
2) Tolerance
In the beginning phase of flooding in the monsoon period of 2013–2014, citizens in Jakarta who were suffering as a result of the events were highly reactive to the disaster. This is demonstrated by comparing and contrasting the preliminary and end phases of the monsoon. This involves an analysis of peak numbers of flooded areas and tweets around certain time intervals, shown in Figure 6 (a) and 6 (b). It can be seen in the preliminary phase in Figure 6 (a) that there were approximately 6,800 tweets from about 9 flooded areas at a particular point in time.
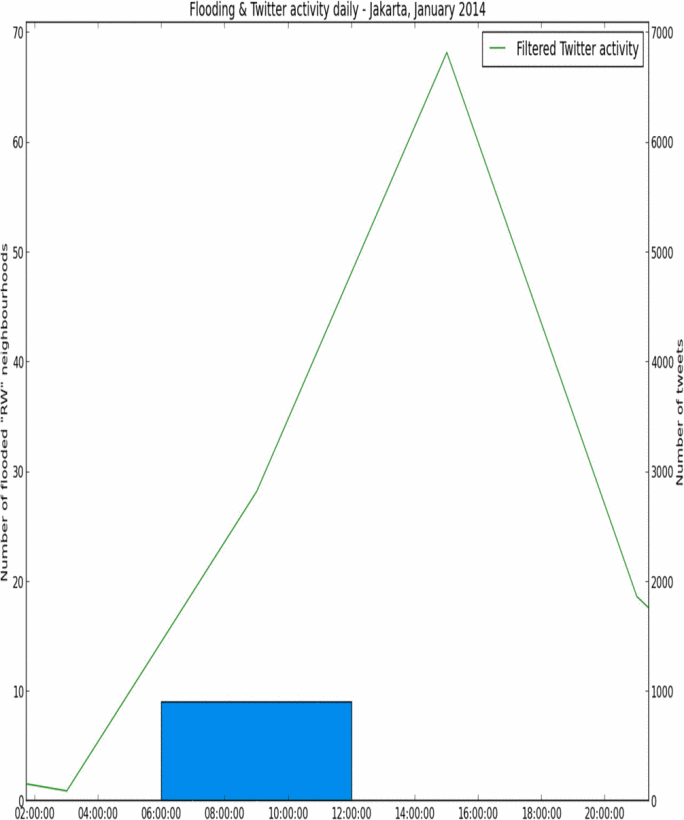
Figure 6(a)
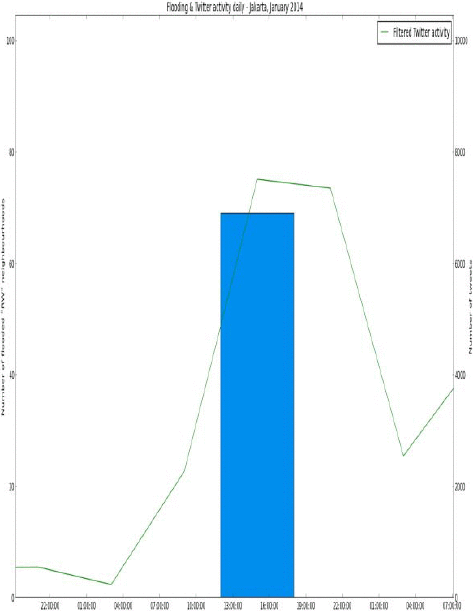
The initial flooding event is marked by the letter ‘I’ (Figure 5). The number of tweets is 700 times greater than the number of flooded areas. When the number of tweets reached 33000, the number of flooded areas also increased to 60, and similarly the amount of tweets was still much greater (550 times) than the number of flooded areas at that exact point in time. Nevertheless, in the end phase, there had not been any flooding events for a series of days. Shortly after, when a flooding event occurred, the number of tweets increased to the highest point of about 7,500 corresponding to about 70 flooded areas. The number of tweets was approximately 100 times greater than flooded areas around the same time period. Based on the findings showing that the numbers differ between the preliminary and final phases, it can be concluded that the reactivity of citizens to flooding decreased from 700 and 550 to 100. The term ‘tolerance’ explains this phenomenon.
B. Interpreting the Patterns of Tweet Activity
It is worthwhile pondering why there was a lot of Twitter activity at the beginning of every monsoon period, and why over time, Twitter activity decreased with the intensification of the flooding. On the surface the obvious reasoning has to do with the fact that when flood waters rise or peak, there is much that needs to be done to sustain life, ensuring that loved ones, property and livestock are out of harm's way. It is not unusual for up to 20,000 people to have to be evacuated due to being trapped in rising floodwaters- from those living in wealthy suburbs to those living in riverside slums. When there is torrential rain causing flooding in Jakarta, the inner city is brought to a stand-still- the sheer volume of the megacity amplifying the already difficult situation, causing massive economic losses. A second contextual reason for Tweets reducing in intensification over time, has to do with the length and depth of the monsoonal activity in a given time-period (i.e. season). It is not unusual for Jakarta to experience between four to six almost back-to-back flooding episodes, each with varying degrees of severity and impact. After the initial onset of the first flood during the monsoon season, Jakartans quickly weary of repeat flooding, especially if it is flooding of a relative superficial nature, where flood waters rise to say a meter disrupting transportation and other vital services, but do not present an imminent danger to human life or animal life. Realistically, how many times, can one Tweet “here come the floods, again #banjir” before tiring of a near identical message. Additionally, locals would be more preoccupied with clean-up efforts required post flooding for a return to normal living than Tweeting. The pattern is something like this: the rains come, the water rises, the damage is done, and the water recedes over time. And then the process begins all over again. Twitter in this instance, could be used to aid in particular crisis situations, certainly, but more importantly gathered Twitter data could direct government agencies at the local and city levels, that longer-term transformation is necessary to ensure that monsoon activities do not keep flooding Jakarta for the next 100 years, especially as sea levels continue to rise. A final interpretation on why the number of Tweets decrease over time has to do with the well understood crisis management cycle [xi]. That is, there is a heightened awareness in individuals at the beginning of a crisis. They may raise alarm bells, hoping to avert a looming disaster, wishing for early detection to signal some change. This might be when many people begin tweeting, to help families, friends, neighbours, municipal authorities to try and prevent predictable situations. E.g. “don't use road X but go via road Y #banjir”. So while the damage is being done, containment becomes a pertinent factor. While people are recovering they may be likely tweeting about positive things that are unrelated to floods, to allow themselves the ability to re-engage with everyday life.
SECTION VII.
Conclusion
As a part of and based on the project PetaJakarta.org, this research has been conducted using a systematic approach, and in an objective manner, whereby the results are derived primarily from crowd-sourced data from everyday citizens. The 4 principal findings of the study included:
Most Twitter users tweet once during flooding using keywords in their native language.
The fluctuation in the number of tweets is not consistent with the number of flooded areas.
There is a statistically significant relationship between the number of flooded areas and the number of tweets at the 95% confidence level.
There is a linear regression between the number of flooded areas and the number of tweets.
SECTION VIII.
Next Steps
Given the complex nature of flooding, this research did not develop effective mathematical models to demonstrate the relationship between the flooding events and Twitter activity. Developing an understanding of the spatial and temporal relationships between Twitter activity and flooding at the “RW” level in Jakarta, with the aim of producing a trigger metric for flooding based on Twitter activity, requires further experimentation. It is suggested that such an experiment be based on the following three steps:
Examine the spatial distribution of Twitter activity across the city during flood events using spatial clustering analysis, and compare this qualitatively to spatial distribution of flooding.
Perform a statistical test that calculates the difference between the counts of spatiotemporally paired Twitter activity related to flooding and flooding events.
Perform a statistical test on counts of tweets before and after flood events to see if there is a significant difference between flooding events and Twitter activity.
The long-term goal of this research is to quantify the utility of social media data during flood events within the context of a civic co-management framework. Importantly, governments, emergency services organizations, media broadcast hubs, and related local authorities need to have a clear strategy on how social media fits into their overall plan. Is it to support longer-term planning and infrastructure goals at the municipal level or as just-in-time information that can be broadcast to help raise awareness about impending disaster zones or affected areas in order to save lives? One thing for certain is that the development of data-driven decision-making capabilities is crucial to harness the enormous body of information that can be unlocked from social media platforms like Twitter or Facebook. From the Queensland Floods of January 2011, we learnt that data generated on a microblogging platform did not necessarily stay within its native environment, but emerged on cross-media platforms of all sorts, even television as live tickers. There is much to be said about the interoperability of various social media engines, what data can be gathered to convey critical updates during a crisis, and how best to communicate complex findings in say, evacuation situations, without alarming affected individuals, bringing them to safety. Different stakeholders will also require various communication strategies, from an emergency services coordination center that might wish for large-scale dashboards they can visualize on big screens, to microblogging messages to those waiting for instructions on whether to “evacuate” or “stay calm and wait”. Future utilities may well use data feeds from across social media sites to validate and confirm reports that are crowdsourced.
ACKNOWLEDGMENT
The Twitter data used in this study was provided through a Twitter #DataGrant awarded to the PetaJakarta.org project at the SMART Infrastructure Facility, University of Wollongong. The authors wish to thank both Twitter and the Emergency Management Agency of Jakarta (BPBD DKI) for their support in provision of data to support this research. Additionally, this research is supported by an Australian Government Research Training Program (RTP) Scholarship.
References
1. K. Michael, “Location Based Services in Emergency Management,” Public Sphere 3: ICT & Creative Industry Development, 2009. Available: https://www.youtube.com/watch?v=scVaOr8ULzw
2. S. Marusic, J. Gubbi, H. Sullivan, Y. W. Law, and M. Palaniswami, “Participatory sensing, privacy, and trust management for interactive local government,” IEEE Technology and Society Magazine, vol. 33, no. 3, pp. 62–70, 2014.
3. M. F. Goodchild, “Citizens as sensors: The world of volunteered geography,” GeoJournal, vol. 69, pp. 211–221, 2007.
4. M. Haklay, A. Singleton, and C. Parker, “Web mapping 2.0: The neogeography of the GeoWeb,” Geography Compass, vol. 2, pp. 2011–2039, 2008.
5. D. M. Boyd and N. B. Ellison, “Social network sites: Definition, history, and scholarship,” Journal of Computer-Mediated Communication, vol. 13, no. 1, pp. 210–230, 2007.
6. S. J. Fusco, R. Abbas, K. Michael, and A. Aloudat, “Location-based social networking: Impact on trust in relationships,” IEEE Technology and Society Magazine, vol. 31, no. 2, pp. 39–50, 2012.
7. S. J. Fusco, K. Michael, M. G. Michael, and R. Abbas, “Exploring the social implications of location-based social networking: An inquiry into the perceived positive and negative impacts of using LBSN between friends,” in Proceedings of the 9th IEEE International Conference on Mobile Business (ICMB), Athens, Greece, 2010.
8. C. Smith, “Crazy conspiracy theory: What if Pokémon GO was used for massive spying operations?,” BGR, 2016. Available: http://bgr.com/2016/07/12/pokemon-go-location-camera-privacy/
9. F. Harvey, “To volunteer or to contribute locational information? Towards truth in labeling for crowdsourced geographic information,” in D. Sui, S. Elwood, and M. F. Goodchild (Eds.), Crowdsourcing Geographic Knowledge, Dordrecht: Springer, 2011, pp. 31–42.
10. D. Quercia, L. Capra, and J. Crowcroft, “The social world of Twitter: Topics, geography, and emotions,” in Proceedings of the Sixth International AAAI Conference on Weblogs and Social Media (ICWSM), 2012, pp. 298–305.
11. I. Mitroff, Crisis Management: Leadership. Hoboken, NJ: John Wiley & Sons, 2004.
Authors
School of Computing and Information Technology, University of Wollongong, Australia
Faculty of Engineering and Information Sciences, University of Wollongong, Australia
Urban Risk Lab,Massachusetts Institute of Technology, Cambridge, United States of America
Urban Risk Lab, Massachusetts Institute of Technology, Cambridge, United States of America
Citation: K. Yang, K. Michael, R. Abbas and T. Holderness, "Urban flood modelling using geo-social intelligence," 2017 IEEE International Symposium on Technology and Society (ISTAS), Sydney, NSW, Australia, 2017, pp. 1-9, doi: 10.1109/ISTAS.2017.8319086.