A theory of exposure: Measuring technology system end user vulnerabilities
Citation: L. Robertson, A. M. Aneiros and K. Michael, "A theory of exposure: Measuring technology system end user vulnerabilities," 2017 IEEE International Symposium on Technology and Society (ISTAS), Sydney, NSW, Australia, 2017, pp. 1-10, doi: 10.1109/ISTAS.2017.8319089.

Photo by Etienne Boulanger on Unsplash
Abstract
People are reliant on technology systems for their survival and everyday convenience. From access to clean drinking water, to electricity for cooking, to fuel for driving vehicles to and from work. When a technology system that people rely on is inoperable or inaccessible, end-user vulnerabilities can increase acutely and substantially. While end-users are quite resourceful, a few days without water or electricity or fuel, can quickly turn into a humanitarian or security crisis, especially in densely populated areas. This paper's contribution is a measure to study technology systems and the extent of their contribution to end-user vulnerability. A theory of exposure is presented with a corresponding measure of how to determine exposure of any given technology system, agnostic of geography location or socio-economic circumstances. It is argued, that if the exposure of any given technology system can be reduced, that end-user vulnerabilities are also reduced, providing some control over extreme or unintended events. Researchers and practitioners can use these outcomes on existing technology systems toward optimization, or on new technology systems being introduced into a cyberphysical environment. The accuracy, precision and scaling of the proposed exposure measure are also examined in this paper.
SECTION I.
Introduction
The aim of this paper is to introduce a theory of exposure to aid in the reduction of end-user vulnerability. In recent times, there has been a great deal of discussion around the securitization of cyberphysical systems. Today, access to clean drinking water and access to electricity is a high-tech affair. Technology management systems are highly networked and some are even determined to be smart. As we continue to develop highly internetworked systems to manage smart grids and smart meters in smart homes, the problem of end-user vulnerability becomes especially non-trivial. Risk management standards refer to a notion of “exposure” that has not yet received a great deal of attention. In this paper we extrapolate what “exposure” is and how it can be measured in any arbitrary complex technology system.
A. Risk as Relevant to the Principle of Exposure
Published literature cites a variety of definitions of “risk”, and the variety is notable, considering the common usage of the term. Significant references include AS/NZS ISO 31000:2009. Risk Management - Principles and Guidelines[1], which proposes to define risk as the “effect of uncertainty on objectives”. In this definition, uncertainties include events that may or may not happen, and uncertainties caused by ambiguity or a lack of information. As stated, “objectives” is plural, and “uncertainty” encompasses all possible factors, across all possible circumstances, i.e. the definition is extremely broad. Similarly, ISO GUIDE 73:2009 Risk management - Vocabulary[2] defines risk as the “effect of uncertainty on objectives” and also (3.6.1.3) as a “structured statement of risk usually containing four elements: sources, events (3.5.1.3), causes and consequences”. Risk sources (3.5.1.2) are an “element which alone or in combination has the intrinsic potential to give rise to risk”; Event (3.5.1.3) as “occurrence or change of a particular set of circumstances”; and Hazard (3.5.1.4) as “source of potential harm” (3.5.1.2). Likelihood (3.6.1.1) is defined as the “chance of something happening”. In risk management terminology, the word “likelihood” is used to refer to the chance of something happening, whether defined, measured or determined objectively or subjectively, qualitatively or quantitatively, and described using general terms or mathematically (such as a probability (3.6.1.4) or a frequency (3.6.1.5) over a given time period. Exposure (3.6.1.2) is the “extent to which an organization and/or stakeholder (3.2.1.1) is subject to an event”; Consequence (3.6.1.3) is the “outcome of an event (3.5.1.3) affecting objectives”; and Probability (3.6.1.4) is the “measure of the chance of occurrence expressed as a number between 0 and 1, where 0 is impossibility and 1 is absolute certainty”.
For insight into the origins of the term, the Oxford English Dictionary cites the earliest use of the word in English (in the spelling of risque) as from 1621, and the spelling as risk from 1655. It defines risk as: “(Exposure to) the possibility of loss, injury, or other adverse or unwelcome circumstance; a chance or situation involving such a possibility”. It is noted that this definition emphasises probability, rather than certainty of harm. BS OHSAS 18001:2007[3] states that “risk is a combination of the likelihood of an occurrence of a hazardous event or exposure(s) and the severity of injury or ill health that can be caused by the event or exposure(s)”. This definition is closest to that used by risk practitioners, combining probability with magnitude of consequences.
It therefore follows, when a technology system that people rely upon is inoperable or inaccessible, end-user vulnerabilities are demonstrated quickly and acutely. While end-users are resourceful, a few days without water or electricity or fuel, can quickly turn into a humanitarian or security crisis, especially in densely populated areas. This paper's contribution is a measure to study technology systems and the extent of their contribution to end-user vulnerability. A theory of exposure is presented with a corresponding measure of how to determine exposure of any given technology system, agnostic of geography location or socio-economic circumstances.
SECTION II.
Background: Operationalising Exposure
Approaches to the development of valid measurements generally have been previously described by Hand [4] and Suppes [5]. A valid measure of a technology system's contribution to user vulnerability requires a generalizable representation of a complex technological system which may include: a large number of operations and intermediate steps, partial design redundancies and also single points-of-failure. The representation must at least be homomorphic in terms of the operations and streams, and preferably isomorphic in order to give assurance that the representation does not omit significant features of a real world system. It is further necessary to identify from that representation:
An attribute that can be demonstrated to be a valid measure of the phenomenon of interest
A confirmation that the metric is invariant with respect to irrelevant factors
Evidence that it incorporates all relevant factors and thus is complete
Evidence that there are no correlated variables
Evidence that it has definable levels of both precision such that independent researchers can obtain outputs that are numerically similar, and acceptable accuracy.
It is also necessary to evaluate the application scope of the metric and the scale factors i.e. the rate of change and scope of values of the metric, and to evaluate how the values derived for the metric will correlate with conclusions reached.
A. End-User Services Definition
The discussion of technology contribution to end-user vulnerability focuses on the delivery of goods and services to the end-user. An adequate definition of a service level and of the specific goods and services allows a Boolean variable to define this delivery or non-delivery. The description of goods and services and a service level therefore allows a clear definition of delivery for a particular case, but does not preclude a separate examination of technological vulnerability associated with various different service levels.
Once a defined level of service from a technological system is identified, a recursive application of that service level output will also define the nominal state of all streams and processes upstream of the final delivery of goods or services. This set of states that represent nominal operating conditions for defined service level, also allows a clear definition of a maximum tolerable disturbance for each stream and process variable, as the perturbation from nominal state that will cause failure to achieve the service level output. The definition distinguishes the dynamic vulnerability situation from a static vulnerability measure.
B. End-User Focus
The paper focuses on the end-user‘s vulnerability with respect to any given technological system that delivers a given good or service. The emphasis is on the contribution of the technological system rather than the significance of the particular goods or services under consideration.
C. Heterogeneous System Description and Representation
The technological systems' contribution to vulnerability cannot be constrained to consideration of that portion of the technological systems that are responsible for the final distribution of completed goods or services. It must be assumed that the contribution arises from the whole technological system, which includes the incremental addition of value to the goods and services, which is distinguished from the simple distribution of goods that is implicit in the analysis of supply chains and in the analyses applied to computer communication systems and power or water distribution systems. The analysis of technological system contribution to vulnerability therefore requires the characterisation of a technology system that is heterogeneous and must therefore consider processes, intermediate streams of different types, and sources of inputs.
D. Static and Dynamic Contributions
Much has been previously published on the concept of vulnerability. Significant divergence and lack of clarity among published definitions has been noted. The proposed approach to improving the precision of these varied definitions, is to assign the term “dynamic vulnerability” to describe the dynamic response of a functioning system, to a specified perturbation. Metrics of dynamic vulnerability measure the response of a system starting at a defined status, to a defined perturbation. Dynamic vulnerability is then the inverse of resilience. Dynamic vulnerability describes the system continuous response within operational regimes that continue to deliver the service level output. The dynamic vulnerability of a technological system therefore measures system resilience rather than user-vulnerability.
Having assigned the term dynamic vulnerability to describe dynamic and continuous responses and having defined the scope of that term, the term static vulnerability is proposed to describe the contribution of vulnerability that is made to the user by the technological system components and configuration and related to the achievement or otherwise of the service level output. Herein, we show that the proposed exposure metric is a valid measure of static vulnerability. It is proposed that static vulnerability should be considered as a precise antonym of robustness, noting that robustness is commonly associated with the design and configuration of a technological system, rather than the margin between design and overload performance.
SECTION III.
Exposure and Vulnerability
The end-user focus and the definition of service level generates a very clear and simple target for the consideration of vulnerability. The variations of definition of vulnerability commonly include the concept of “susceptible to attack”, which requires a clear definition of the term “attack”, and the definition of “susceptible”. This research seeks to quantify the contribution made to vulnerability by a technological system and so must avoid dependence on an exhaustive list of external events that could contribute to failure, and also must avoid dependence on assessment of the probability of any of those events occurring. This approach pre-supposes that if a weakness exists, it could cause failure due either to random events, over a long timeframe, or due to malicious activity within a short timeframe.
Since the probability of external hazards does not affect the specific contribution to end user vulnerability of the technology system, any aspect of the technology system which is capable of causing failure makes the same contribution to vulnerability as any other aspect of the technology system capable of causing failure. Assuming either long timeframes or the presence of malicious activity, the contribution to vulnerability of the technological system can be associated with the number of loci of failure that are possible, and can be associated with the configuration of the technological system. A theory of exposure can then be proposed as: An end-user‘s vulnerability to a technological system supplying specific goods and services is measured by the number and nature of points-of-failure which are expressed as the “exposure” of that technological system.
A. Previously Published Techniques and Gaps in Literature
Risk analysis approaches do not prescribe a description of the target technology system at all, and hence do not necessarily derive any measure that relates specifically to the technology system. Resilience analysis and Failure Modes and Effects Analysis (FMEA) both offer foundational concepts that can contribute to a metric that meets the requirements of this research, because both require a clear definition of the target technological system. A FMEA analysis commences by establishing a very clear definition of a technological system that is commonly an interconnected system of valves, pipework, pumps and control systems, and then examines the effect of the failure of each component within that system. FMEA commonly assumes a Boolean (fail or operate) status of each input though in some cases a fail-open, fail-closed, and fail-fixed modes may be considered. The analysis normally examines the effect on the system output. FMEA analysis commonly results in a tabular representation of the effect of each selected-component failure. FMEA is commonly carried out to establish whether a defined level of design redundancy (N-1, etc.) has been achieved. For example, if an N-1 design redundancy (system failure cannot be caused by the failure of any 1 component) is specified, the FMEA would examine the effect of each individual component failure upon system output. If N-2 design redundancy were specified, i.e. system failure cannot be caused by failure of any 2 components, then FMEA would examine the effect of each possible combination of two component failures upon system output.
The FMEA analysis approach that examines fail or no-fail conditions of each component individually without design review to achieve specified design redundancy, can be extended to generate a tabulated representation of the single input fail criteria that cause a failure to meet the service delivery criteria. Therefore, if each possible failure mechanism could be evaluated either as operational or non-operational, and that the delivery or non-delivery to end user is the final output, then FMEA outputs could be represented in a tabular format showing single failure causes.
Such an analysis generates output responses to single inputs, and so does not completely characterise a system whose failure may arise from combinations of failures. The development of a complete theory of exposure requires that all of the potential failure modes of a technological system are defined and characterised, and are shown to provide a valid measure of the attribute of interest. This is the capability to be contributed by the creation of a theory of exposure.
SECTION IV.
Development of Exposure Metric
A. Measurement Theory-the Criteria for a Metric
“Measurement” is itself a concept requiring careful application to any new analysis approach, in order to assure the relevance of the proposed approach. Suppes [5, p. 825] notes that:
“A conceptual analysis of measurement can properly begin by formulating the two fundamental problems of any measurement procedure. The first problem is that of representation, justifying the assignment of numbers to objects or phenomena. What we must show is that the structure of a set of phenomena under certain empirical operations and relations is the same as the structure of some set of numbers under corresponding arithmetical operations and relations. Solution of the representation problem for a theory of measurement does not completely lay bare the structure of the theory, for there is often a formal difference between the kind of assignment of numbers arising from different procedures of measurement. This is the second fundamental problem, determining the scale type of a given procedure”.
Similarly, Hand [4, p. 3] writes that “.quantification: the assignment of numbers to represent the magnitude of attributes of a system we are studying or which we wish to described.”. This definition is operationalised initially by noting the previously established context for the measurement and a “phenomenon of interest”, by representing the heterogeneous system in some way, establishing a mapping from the real system to a system that corresponds to, and behaves in the same way as the real system, within which a measure can be developed. Finally, the definitions are operationalised by defining an attribute to represent the phenomenon of interest, and confirming the validity of the measure.
B. Representation of Heterogeneous System
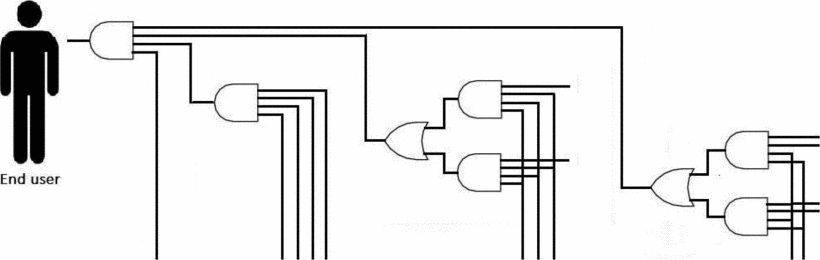
Figure 1. A representation of a complex technological system
Heterogeneous technological systems can be described as progressively adding value to raw inputs, and ultimately generating a specified output. These systems could also be described in terms of applying processes to input and intermediate streams, generating further intermediate streams until the final output is created. It should be noted that a homogeneous system (e.g. a supply chain) is a special case of a heterogeneous system, since within a homogeneous system the process types are limited to aggregation and distribution, with no transformations.
The definition of a service level of output allows representation of the output using a Boolean variable. Consider the final delivery of the goods or services to a user, this can be assumed to be feasible if a set of conditions are fulfilled, e.g. a road exists, an operational truck is available, fuel and a driver are available. This could be represented as a Boolean AND function with 4 inputs. If each of those inputs are in turn considered, it is proposed that their availability can also be represented as a Boolean variable, which is the output of a Boolean function of several inputs. Extending this principle allows a complete technological system to be represented as a complex Boolean algebraic expression, which considers the specific processes, the intermediate streams and the input streams, and results in a Boolean representation of the service level delivery conditions for defined goods or services to an end-user. Figure 1, using standard symbols for AND and OR gates, illustrates a simple example of this approach.
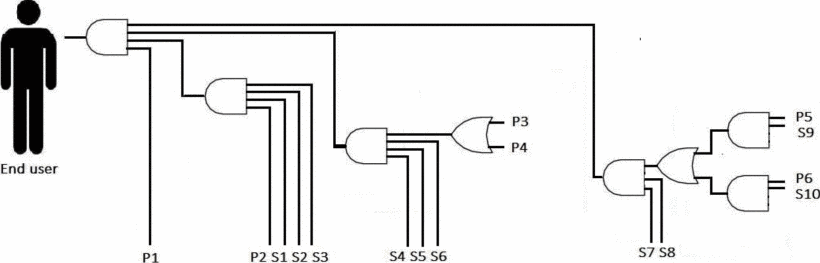
Figure 2. Re-drawn representation of a complex technological system
Figure 1 provides a more realistic example of a heterogeneous technological system, including cases in which some streams have alternative sources, and including processes that have some common and some unique requirements. Real technological systems may also include operations that are mutually exclusive, indicating a need for a functionality representing the case where IF (a) then NOT (b). Such a “NOT” construct can be used in conjunction with the definition of stream availability level for example to describe a situation in which the sufficient level of stream capacity to ensure functioning of (a) will preclude sufficient level of stream capacity to ensure functioning of (b).
A computationally complete Boolean algebra requires only the “and”, “or” and “not” constructs, and these have been shown to be sufficient to represent an arbitrary heterogeneous technological system for delivering goods or services to an end-user. The final service delivery can be represented by a Boolean variable, and by applying the definition recursively, intermediate streams can be considered to have Boolean values according to whether they do, or do-not cause failure of the final service-level delivery. This allows the representation of streams and processes availabilities as Boolean variables. The “NOT” function can be used, though its value in the field of this thesis is problematic, but there is no function which allows “distribution”, and so a stream-availability cannot be simply assigned to the input of more than one gate. The system needs to be re-drawn as demonstrated in Figure 2. This redrawing illustrates the correct treatment of the case where an input stream affects more than one process.
C. Interpretation of the Data
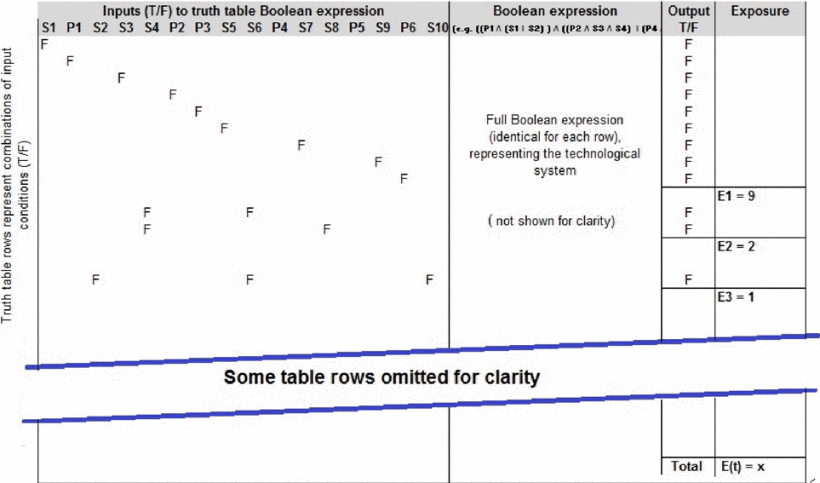
Figure 3. Representation of system inputs and outputs using a truth table
A truth table, as illustrated in Figure 3, based on Boolean algebra, and including all valid (process and stream) inputs, can be used to represent the possible outputs of the technological system for each possible combination of input availability or non-availability.
The response of a technological system, represented by a Boolean expression, can be represented using a truth table listing all permutations of inputs and the corresponding single output. Representative parts of such a truth table are illustrated in Figure 3 above, and from this it can be seen that there are a number of points for which a single failure will cause the system output to fail. These are summed to generate the E1 value, representing the highest level of vulnerability. There are also cases where a combination of two or more failures will need to occur simultaneously in order to cause the system output to fail. These generally arise from duplicated systems, are represented using “OR” gates, and are added to give the E2 value. Continuing this approach it is possible to construct a composite metric of the form {E1, E2, E3… En} where E1 is the number of single points of failure, E2 is the number of cases where two independent failures must occur in order for the system to fail. The E2 value must exclude cases where either one of the inputs would alone have caused output failure - otherwise the values would be over-represented. Similarly, the E3 value must exclude cases where a combination of two of the failing inputs would have caused output failure. This representation and concept expands upon the “N-1”, N-2” design redundancy concept, arguably adds rigour to that definition, and is proposed to provide a measure of the relevant attribute.
It has been previously argued that probabilities of a particular process or stream failure, i.e. the probability that a hazard aligned to that process or stream is of sufficient magnitude to cause the operation of the process or stream to fall below a level which would cause failure of the technology system output, should be excluded from consideration for two reasons. Firstly because these will tend towards a probability of 1.0 over a sufficiently long timeframe or under the assumption of directed attack, and secondly because they are characteristic of external hazards rather than the intrinsic components and configuration of the technological system which are the topic of the research question. It has been also established that a) arbitrary heterogeneous technological systems supplying to a single point with a defined service level, can be represented as a Boolean algebraic expression, and b) that the response of the system to permutations and combinations of failures can be represented in the form {E1, E2, …En}. It is therefore argued that the number of vulnerability points, i.e. possible points of failure, of the technological system is a valid mapping of the “vulnerability that can be attributed to the technological system” onto an attribute. Within AS/NZS ISO 31000 [1], the definition assigned to the term “exposure” is closely related to the concepts described above, and so for the purpose of this work, the quantitative evaluation {E1, E2…En} will be referred to as the exposure of the technological system.
D. Scoping the Bounds of Exposure
1) Granularity
Generating an accurate exposure value requires a careful consideration of assessment process and specifically the granularity of the representation: To illustrate using an example, if every transistor in a memory chip were considered as a potential cause of failure, the exposure value calculated for the computer would be exceedingly high. If by contrast, the computer were considered as a complete, replaceable unit, then it would be assigned an exposure value of 1. A pragmatic definition will address this issue: if some sub-system is potentially replaceable as a unit, and can be attacked separately from other sub-systems, then it should be considered as a potential source of failure. This definition is proposed to allow an adequate level of precision - i.e. reproducibility by different practitioners.
2) System Boundaries
Some pragmatic observations can be made: Since, for example, the E3 combinations cannot by definition include any E2 or E1 combinations, and E4 combinations cannot include any E3, E2 or E1 combinations, there will be a tendency for En values to decrease as n increases. Upper bounds can be set: for a system with N inputs, and if E1=n, then E2<=(2(N−E1)) etc. and it can be observed that if a system with N inputs has a En value of 1, then this system can only be a single “OR” with N inputs and all higher E values (E1…E(n−1) must be zero. The proposed approach is therefore to nominate a level, to which exposure values will be evaluated. If, for example, this level is set at 3, then the representation would be considered to be complete when it could be shown that no contributory systems added to the E3 values of the system as represented.
3) Contributory Systems
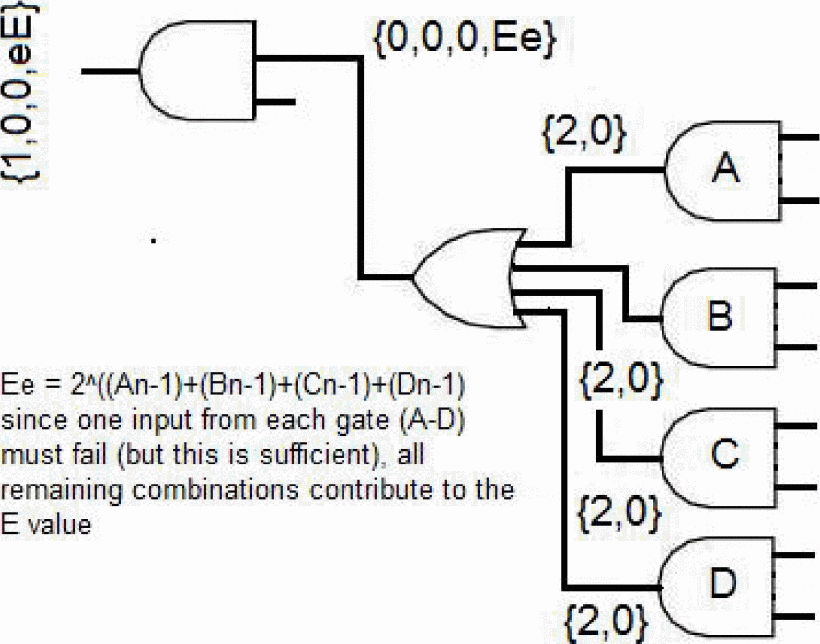
Figure 4. The impact of contributory systems on the end-user
It can be expected that there will be cases where a stream that is an input to one technological system is itself the product of another technological system, i.e. a contributing system. The technological system that generates the input will itself have some degree of exposure, and it is important to have a valid basis for calculating what contribution is made to the exposure of the end-user. This issue is illustrated in Figure 4.
A more generalised approach is required. The problem can in fact be generalised by considering that each input to a gate (Boolean AND or OR operation) has an exposure vector, and developing the principles by which the gate output can be calculated from these inputs. This is illustrated in Figure 5.
For the AND gate, the contributory exposure vectors are simply added component-wise, hence the output metric is
{ (A1+B1+C1), (A2+B2+C2), (A3+B3+C3) … (An+Bn+Cn)}.
For the OR gate the issue is more complex. For the case where there are three inputs to the OR gate the calculation is as shown in Equation 1:
Equation 1
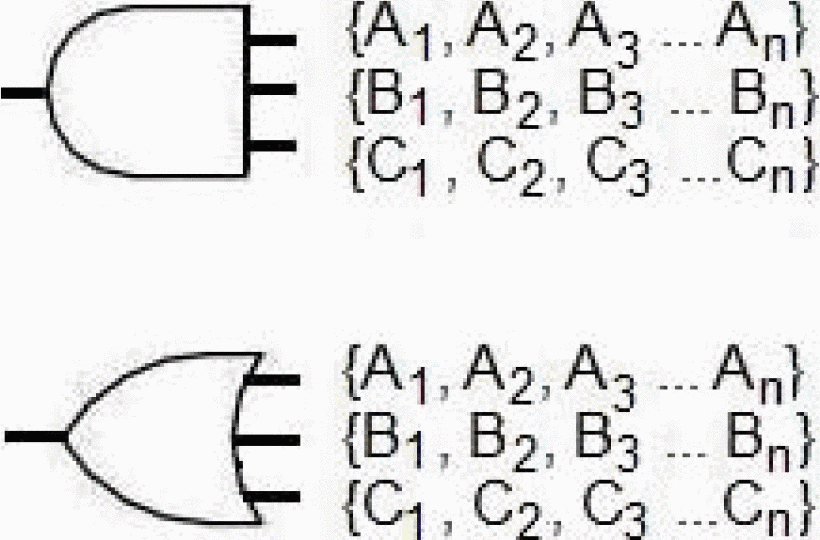
Figure 5: Generalised approach - contributory system
It should be noted that when calculating the E3 value, one fail from each input must occur for the output to fail, however each remaining combination of fail's contributes to the E3 value. The E4 and subsequent values are calculated in exactly the same way as the E3 value. It can be noted that, since the contributory system has effectively added streams and processes, the length of the output exposure vector is increased when the contributory system is considered. In principle, an exposure vector of very great length could be postulated.
4) Accumulated Significance of Contributory Values
The fact that contributory E1 values are added to the total exposure of a parent system is significant: a single point of failure is not lost when the contributory system is added to the parent system. As a practical example, if the “O” ring seal failure had been identified as a contributor to the E1 exposure of the Thiokol Solid Booster Rocket then the elimination of all E1 values for the parent system that was the Challenger space shuttle, could not have been achieved unless the “O” ring weakness were addressed. The use of an exposure metric potentially addresses the colloquial saying “it's always the smallest things that get you”.
E. Interpretation of “Exposure” Values
A significant purpose of this investigation is to allow evaluation of proposed changes and the comparison of technological systems. The effectiveness of proposed changes can be assessed by considering the composite metric. It might for example, be considered valuable if the E1 value were reduced by a given percentage. Comparison of technological systems is difficult unless the defined attribute can be validly assigned a single value that can be proven to be mapped from the actual “exposure”. It is desirable to have a rational means for converting an exposure represented in the form {E1, E2, E3… En} into a single value. The mapping from the exposure expressed as {E1, E2, E3 … En}, onto a single attribute value could be made in several ways, the most direct approach considers that there is likely to be an average cost of protecting each point of exposure, and hence simply adding the unique E1,E2, E3 values provides a single value for the attribute, that offers a reasonable means of comparing technological systems. It is also noted that a qualitative interpretation of the distribution of E1, E2 etc. values will provide additional insight and would also allow the assessment of progress towards, for example, a target of E1=0. This conclusion assumes that the E1 and E2 etc. combinations are exclusive, as previously defined.
F. Application to Example
A highly summarized example will demonstrate these concepts. We may consider the technological system that allows petrol to be dispensed into a user's motor vehicle. The technological system commonly used for this delivery requires petrol pumps, petrol, metering and pump control systems at the petrol station, staff facilities necessary for a manned station, an EFTPOS system for financial transactions, and a bulk petrol supply chain including refining and bulk fuel transport. Multiple forecourt pumps are available and do not contribute significant exposure, but a single control system is a single point of failure and represents significant exposure. A dependence upon an EFTPOS system contributes a large level of exposure attributable to that subsystem, and subsystems that supply staff facilities at the petrol station also contribute large levels of exposure for a manned station. Refinery facilities may constitute single points of failure, but multiple bulk supply vehicles and routes ensure that the transportation of bulk supplies is not highly exposed in an operational timeframe.
SECTION V.
Evaluation of Proposed Approach and Metric
Recognition that long supply lines and systems with large numbers of potentially fatal flaws and with no alternative sources are “exposed”, could be found in documents as historical as Sun Tsu, The Art of War[6], in the concern expressed by Sen. John Glenn's regarding the Mercury spaceflights [7], and in very many other publications. While published definitions of “vulnerability” may not be precise, these observations indicate that the exposure attribute is a valid representation of the phenomenon of interest. In addition to providing a valid representation it must be demonstrated that the proposed assessment of exposure is a reproducible and accurate measure that actually represents the technological system's contribution to vulnerability.
A. Representation
An evaluation is needed of whether the proposed theoretical basis, i.e., the numerical evaluation of “exposure”, actually represents the performance indicator described in the research question, by considering the validity criteria proposed in works such as Hand [4]. Hand's concepts of “criterion validity” and “content validity” seem of lesser relevance, since they are related to other comparative measures whereas the proposed measure has been developed in response to an identified “gap”, and therefore does not align clearly with other measures. Hand's [4, p. 133] description of “construct validity”, by contrast, is described as “involv[ing] the internal structure of the measure and also its expected relationship with other, external measures. Construct validity thus refers to the theoretical construction of the test: it very clearly mixes the measurement procedure with the concept definition”.
The term vulnerability generally has two elements. First the knowledge that possible failure modes exist, and secondly the knowledge of practical inability to adequately prevent those modes. The lack of ability to prevent failure modes is likely to include practical issues of physical access to particular loci of potential failure, but is also likely to include an awareness that the multiplicity of such loci and the lack of adequate alternatives present a major practical problem. It is proposed that these somewhat intuitive concepts are actually described in quite rigorous logical terms by the Boolean representation of the technological system involved, and since the exposure metric {E1, E2, E3 … En} is constructed directly from the representation of the technological system, this has a construct validity in the terms proposed by Hand [4].
The extent to which the proposed theoretical basis represents the issues raised in the introduction to this paper, is effectively an examination of the scope and validity of the framework of assumptions and boundaries within which the representation is claimed. In this paper, the rationale for assuming all hazards to have a probability expressed as p=1.0 was established. The definition of service level does, certainly, allow a Boolean evaluation of the provision of a stated service. It might be argued that an infinite number of service levels are theoretically needed to characterise the supply of goods and services, but this is unlikely to be a practical issue. For example, a water supply adequate for two criteria such as “drinking only” and for “normal bathroom and clothes or dish washing and food preparation” is likely to achieve the goals of the measurement. That is, it can help to inform a decision process, and allow for the comparison of alternative technological systems. The exposure metric does depend critically on the system boundaries selected. These boundaries effectively represent inputs that are considered to have an exposure of {1,0,0}, and for a valid calculation, the system boundaries need to be defined precisely.
B. Completeness and Uniqueness
Since the Boolean algebraic representation of the real system will generate the same results in terms of Boolean delivery or non-delivery of service levels, as the real system under the same combinations of input failures, the Boolean representation can be said to be homomorphic. The real system and the Boolean algebraic representation can be said to be homomorphic in terms of the processes and streams. Assuming adequate description of the processes and streams and relationships, it is actually possible to re-draw an actual system from the Boolean algebraic representation which proves that the representation is not just homomorphic, but also isomorphic, allowing an inverse mapping.
C. Adequacy
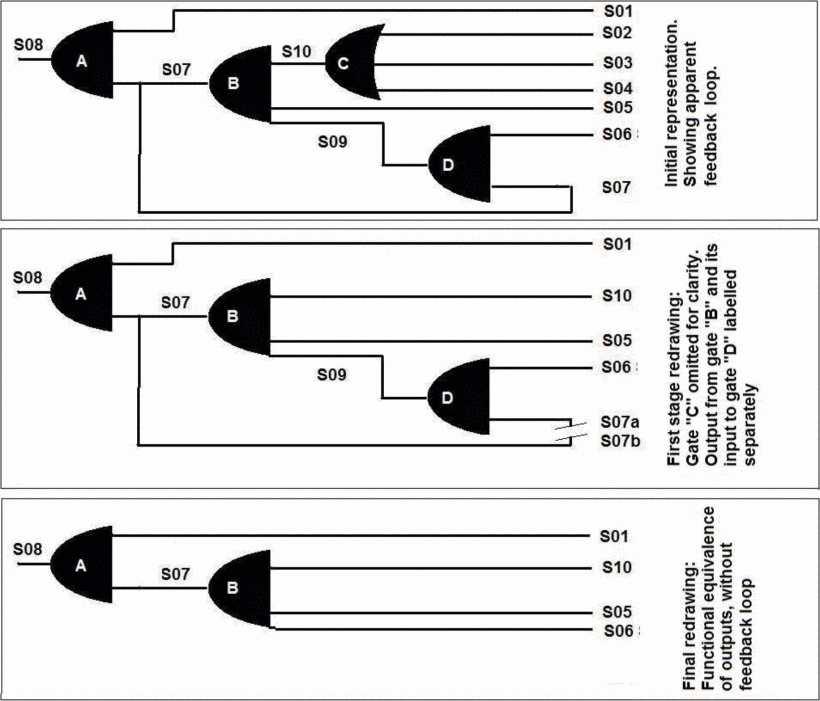
Figure 6. Feedback loop representation
It must be established that it is possible to represent all practical technological systems unambiguously by Boolean algebraic expression. Several authors have drawn attention to the complex interactions and possibly feedback loops between subsystems. It is important to establish with confidence that an arbitrary technological system can be unambiguously represented with a Boolean expression. Consider the “feedback loop” illustrated in Figure 6. For a system e.g. an electronic system, when initial conditions are not pre-determined the output of the system is indeterminate when S05, S06 and S10 are true. The evaluation of exposure considers the number of points that will cause the failure of an operational system, and so initial conditions are always determined. The system can then be simplified as shown in subsequent parts of Figure 3: part “A” is the initial system representation showing apparent feedback loop, part “B” shows an initial redrawing with gate “C” omitted for clarity and the output from gate “B” and its input to gate “D” labelled separately. Part “C” shows a final redrawing: showing the functional equivalence of outputs, demonstrating the practicality of eliminating a “feedback loop”. For systems with input conditions that are not indeterminate, representations of configurations involving feedback can be decomposed to simple Boolean representations and therefore the exposure values can be determined.
Haimes and Jiang [8] consider fractional values of interaction between infrastructural systems, using these fractional values to assess decrease in functionality of one system resulting from decreased functionality of another. These concepts have at least superficial similarity to the colloquial concepts of inter-system feedback. While valuable, Haimes and Jiang's approach to description of interdependence does not quantify exposure as a metric of vulnerability and relies on problematic processes for calculating the levels of interaction.
Feedback must be considered in its broader context. Diamond [9] and others have noted that, within a geographically and economically constrained civilisation, a full positive feedback of failures caused by a single essential resource failure, can cause societal collapse. Geographical regions, e.g. those affected by natural catastrophe, are now not tightly constrained in terms of trade, geography or information, and so disaster relief is possible. Our highly interconnected world is however certainly still exposed to global environmental failures such as major climate change, and Diamond's scenarios [10] emphasize the exposure concept since there are effectively exposure values associated with all major environmental resources including fresh water, clean air and a viable temperature range. These are not discounted, but the topic of this paper is technological contributions and it is the technological contributions to which attention is drawn. Others e.g. Tainter [9] have drawn attention to a wider range of factors.
D. Precision
Precision is achieved when different practitioners apply the same concepts and techniques to a problem, and all generate metrics that are close in value to those generated by others. This is similar to the concept of reproducibility. Achieving an adequate level of precision is closely linked to the definition of system granularity, and indeed to the definitions of what constitutes a “process” and an “intermediate stream”. Consider an example: At a macro level a cell phone needs power only. A main processor unit may contain more than a billion transistors and if any should fail the unit will not operate, and a decision is therefore required on whether assign an exposure value of 1 billion or an exposure value of 1? Two somewhat pragmatic tests can be applied. If a subsystem is able to be replaced as a unit, then it should be considered as a “process”, and if it is practically feasible for an attack to be directed at a subsystem without affecting its neighbours, then it should be considered as a “process”. There is no real mechanism for an attacker to target a single transistor of a chipset, nor is it possible to replace even a processor alone - which would suggest the Personal Computer (PC) as the appropriate level of granularity for a “process”. It would be possible in future to build up a library of exposure vectors for larger components e.g. the PC, to be incorporated into analyses using the principles developed for contributory systems.
E. Accuracy
When considering representation, evidence has been presented that the metric does relate to the quantity of interest - the question of accuracy remains, i.e. whether the measure offers a moderately linear representation of the quantity of interest. Real examples of the importance of this issue can readily be envisaged. If alternative changes to the technological system have, for example, a cost ratio of 2:1, and the alternatives have a ratio of exposure values that also have a 2:1 ratio, then the quality of the decision will depend critically upon the accuracy of the exposure measure. The adequacy of the accuracy of the proposed measure is justified by a simplifying assumption. To adequately mitigate each exposure value will require some effort and expenditure, and while costs might vary significantly between cases, it is reasonable to assume that when a large number of exposure “points” (single or combination failure points) are under consideration, the expenditure for mitigation will bear at least a moderately linear relationship to the number of such points. This principle will apply whether the designer's target is to bring E1 to 0 or E1 and E2 to zero.
F. Validity of a Theory of Exposure
The approach that is developed in this paper, is proposed as a “theory of exposure”, that can be formulated as “An end-user‘s vulnerability to a technological system supplying specific goods/services is measured by the number and nature of points-of-failure, which are expressed as the “exposure” of that technological system”. Wacker [15] proposes that conceptual definitions, domain limitations, relationship-building and predictions are the essential elements of a valid “theory”. This paper provides conceptual definitions, a domain limitation (introduction), relationship-building as a result of validating the metric and a predictive capability since the proposed metric can be used to evaluate potential changes. On this basis it is proposed that the “theory of exposure” as formulated above, has met the definitions of a valid theory.
G. Integration with Other Analyses
The premises leading to the development of a theory of exposure noted that any weakness in a technological system is a potential locus for a hazard, and a hazard of sufficient magnitude when applied to a weakness will cause a failure at that weakness. It has been noted that if hazards are not considered for every weakness, then a risk analysis has fallen short. An analysis of system exposure can therefore add rigour to a risk analysis exercise by ensuring that all weaknesses are considered. It has also been noted that when a weakness is removed, any hazards associated with that weakness become irrelevant: this principle allows the analysis of a system's exposure to inform design choices, promoting those which decrease overall system exposure.
SECTION VI.
Exposure: Definition and Metrics
An internally consistent and defensible set of definitions are necessary to avoid confusion. Figure 7, illustrates many of the concepts presented thus far. The following definitions are proposed, and links to earlier works are noted.
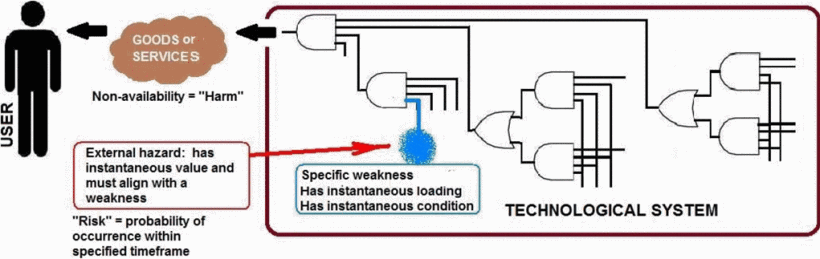
Figure 7. Illustration of selected terms
1) Risk
The probability that a given hazard will occur (at a level above the maximum tolerable level) during a nominated timeframe. Risk must be applied to a hazard that in turn is always related to a specific weakness. A hazard is irrelevant unless it is associated with a weakness. It has already been argued that, when either long timeframes or (mis)guided hazards are considered, risk probability approaches 1.0. If a specific risk has a known probability function, i.e. for a known percent of time it will exceed a nominated value. It is possible to calculate a Bayesian probability that there will be an instant when the loading of a particular weakness plus the hazard value will exceed the maximum tolerable value of that weakness. While this is computationally possible, both the “guided hazard” and the long timeframe arguments deprecate this approach. The practicality of the approach is also hindered by noting that every weakness may have an unlimited number of hazards linked to it, and every potential hazard for every weakness must therefore be considered as a component of a Bayesian probability calculation. This definition aligns with many published definitions, but differs from many nonacademic definitions e.g. the insurance industry's usage that considers an “insured risk” to be the asset that might suffer damage. This aligns with common definitions: Risk is identified as “high” when a hazard is likely to occur, through to “low” when it is assessed that a hazard is unlikely to occur.
2) Hazard
Something that causes a perturbation in the functioning or availability of a process or stream that is part of the technological system - e.g. a severe weather effect e.g. “more than xx mm rain” is a hazard. Consistent with ISO GUIDE 73:2009 Risk management - Vocabulary[2], defines Hazard (3.5.1.4) as a “source of potential harm”.
3) Service_level
Rate of delivery of specified goods or services, to a single point. Definition of a service level allows a Boolean representation of “Harm”, i.e. the non-supply of goods or services.
4) Harm
The failure to deliver some specified level of service or goods. This definition applies equally to the output of a technological system and to the end user failure-to-receive. This definition does not consider the consequence of failure-to-deliver. For example, if a technological system delivers toothpaste, then this definition of “harm” refers to the failure to deliver toothpaste, rather than dental caries (tooth decay) or halitosis (i.e. the harm caused by bad breath).
5) Technological System
The scope needed to produce a service level of specified goods, and where failure will cause specified harm i.e. a failure to supply.
6) Weakness
When applied to a technological system, “weakness” is proposed to be defined as a stream, process or other facility whose function is a part of the technological system in question, and whose absence or inoperability contributes to the possibility of harm. Weakness is directly associated with the potential for harm. That is, the potential that if the locus of weakness fails, then “harm” (a failure to deliver a service) may result. The uncertainty in the “may” is due to two factors: if the attack on the weakness is below the max-tolerable-limit, or that the configuration of the system provides redundancy for the function of the weak-point.
7) Exposure
A metric derived from the number and configuration of weaknesses of a technological system. Exposure is qualitatively related to the difficulty or cost of preventing harm. A high level of exposure means that protection is difficult and expensive as many weaknesses must be protected. This definition clarifies the ISO definition.
8) Vulnerability
A summation, for each combination of weaknesses that can cause the defined harm, of the risk that hazards associated with those weaknesses will cause the harm. If the risk for every hazard is considered to be p=1.0, vulnerability is synonymous with exposure. The entity that is proposed to be “vulnerable” must be identified and could be a person, or a technological system, associated with a specified harm. The definition considers both exposure and total hazard probabilities, indexed to a specific harm. The concept of how close an operational system is to failure is captured by the concepts of resilience and max-tolerable-disturbance, and should not be associated with the term vulnerability. This Aligns with the definition stated by Akgun, Kandakoglu and Ozok [11] who define vulnerability as a “weakness in the system defended”.
9) Robustness
Opposite of exposure. Robustness can therefore also be mapped directly to the exposure metric. A system whose E1 and E2 exposure values are zero could be asserted to be robust, since there values show that there are no single or dual process or stream failures that will cause the system to fail. By contrast a system whose E1 exposure value is high, could be asserted to lack robustness, i.e. be vulnerable, since a failure of any of the contributors to the E1 value will cause failure. The proposed definition is not the opposite of vulnerability, since risk is not involved. The proposed definition relates only to system configuration and components. Published definitions are similar but opposite to the definitions of resilience.
10) System_state
The instantaneous load level of each process and stream of a technological system.
11) System Resilience (Dynamic Vulnerability)
Dynamic output response of a system, to a perturbation whose level is below the maximum tolerable disturbance for the weakness that the perturbation is aligned with. A system is only resilient as long as the output function is continuous with respect to input perturbations. That is, when harm (system failure to meet service level) has not occurred. Any measure of resilience must specify the initial system state, the perturbation level and perturbation target i.e. the weakness. It is argued that whereas the resilience metric is applicable to systems that have not failed, the exposure metric measures possible modes of failure. This division of applicability scopes is valid for common cases such as the supply of 230VAC electrical power, which is generally either available or not, and a system dependent on an electric motor either operates or does not, according to the availability of the power supply. Published definitions of resilience commonly consider system performance responses to perturbations of inputs, and specifically the time taken to return to some defined state or an integration of the deviation of system response against time. These definitions implicitly assume a response function without discontinuities, i.e. that the system does not actually fail, a knowledge of system instantaneous state, and a means of calculating a dynamic response to a specified perturbation.
12) Maximum Tolerable Disturbance
The level of perturbation for each stream or process, over-and-above the system-state loading that is normal for the system service delivery level to the design number of users, that will cause stream or process failure. Simply refines the descriptions used by Gomez et al. [12] and Starossek and Haberland [13], by establishing the clear boundary between an operational system responding to a perturbation, and a system that causes harm, i.e. fails.
13) Resilience_limit
Hollnagel, Leveson and Woods [14] considers how close a system's normal usage is to failure level: this term is proposed to capture this concept. A simple measure might be ratio of max-tolerable-disturbance to normal-state.
SECTION VII.
Conclusions
A. A Valid Theoretical Basis
This paper has developed a theory of exposure and demonstrated how valid constraints on two existing techniques lead to the same conceptual framework for a solution. It has then been demonstrated that an arbitrary heterogeneous system can be mapped onto a Boolean expression and that the evaluation of the Boolean expression for all combinations of process or stream failure generates a metric that is a valid representation of the number of weaknesses (or the number of points requiring protection effort) of a technological system. Finally, it has been demonstrated that this attribute's metric is a valid representation of the phenomenon of interest that the metric is invariant with respect to factors outside the defined context, and does adequately consider all factors that are valid within the defined context and that the accuracy and precision of the proposed measure are fit for purpose. The paper therefore proposes a theory of exposure, expressed as: An end-user‘s vulnerability to a technological system supplying specific goods and services is measured by the number and nature of points-of-failure, which are expressed as the “exposure” of that technological system. Exposure can be measured in existing technological systems or newly proposed systems.
B. A Less Exposed Society
Outside the scope of this paper, analyses of several technological systems supplying goods/services have been carried out, those studies indicate that many current systems have significant exposure and so incur significant vulnerability to the urban user. The analysis of those examples have also allowed the systems' exposures to be grouped into a small number of categories. The categories include initial resource availability, single points of failure that are often located close to the point where services are delivered, complex unit operations, lack of buffering of intermediate streams, highly centralised processes and major contributory systems. It is useful to describe a few of these categories in slightly more detail. A simple user service may acquire large functionality by using an internet connection but a design that requires internet input also causes the user service to acquire the whole exposure of the internet subsystem and the user becomes vulnerable to outage or unavailability of the internet system. Similarly, a financial transaction requirement may be made convenient by offering EFTPOS option, but if the option of cash payment is lost the user service becomes exposed to the EFTPOS subsystem that has very many weaknesses. Both of these analyses emphasize exposure that can be added by contributory systems. As an example of a practical outcome, the analysis of the transaction system design is strongly informed by an analysis of the exposure of the system options, illustrating the value of retaining a cash payment option. In such cases, relatively small changes allow significant reductions in vulnerability; in other cases the analyses have highlighted issues that are very tightly interwoven with current societal approaches and would require significant societal changes to reduce the individual vulnerabilities.
ACKNOWLEDGMENT
This research is supported by an Australian Government Research Training Program (RTP) Scholarship
References
1. AS/NZS ISO 31000:2009. Risk Management - Principles and Guidelines.
2. ISO GUIDE 73:2009 Risk management - Vocabulary.
3. BS OHSAS 18001 ( 2007 ) Occupational Health and Safety. Online at http://www.bsigroup.com/en-GB/ohsas-1800l-occupational-health-and-safety/ Apr 2014.
4. Hand D.J. ( 2004 ) Measurement theory and practice: the world through quantification, Edward Arnold.
5. Suppes P. ( 2009 ) Measurement Theory and Engineering Philosophy of Technology and Engineering Sciences. 825–860. DOI: 10.1016/B978-0-444-51667-1.50034-3.
6. Sun Tsu, The Art of War” Author Sunzi, 6th C BCE. Ref Project Gutenberg eBook #17405 also http://en.wikipedia.org/wiki/The_Art_of_War (Translated by Lionel Giles (1875–1958) Viewed online LJRobertson 12 Apr 2017.
7. Glenn J (Sen) ( 1997 ). Quotation from retirement speech. Seen online at http://www.historicwings.com/features98/mercury/seven-left-bottom.htmlin Feb 2014.
8. Haimes Y Y & Jiang P ( 2001 ). Leontief based model of risk in complex interconnected infrastructures. ASCEJ. Infrastructure Syst. 7 : 1–12.
9. Tainter Joseph A ( 2003. First published 1988 ), The Collapse of Complex Societies, New York & Cambridge, UK : Cambridge University Press, ISBN 0–521-38673-X.
10. Diamond J ( 2005 ): Collapse: How Societies Choose to Fail or Succeed. New York : Penguin Books. ISBN 0–14-303655-6.
11. Akgun, I, Kandakoglu A and Ozok A F ( 2010 ). Fuzzy integrated vulnerability assessment model for critical facilities in combating the terrorism, Expert Systems with Applications. 37 : 3561–3573.
12. Gomez, C., J. Buritica, M. Sanchez-Silva, and Duenas-Osorio L, ( 2011 ). ‘ Optimization-based decision-making for complex networks in disastrous events.’ International Journal of Risk Assessment and Management, 15 ( 5/6 ): 417–436.
13. Starossek U ; Haberland, M ( 2010 ), Disproportionate collapse: Terminology and procedures, Journal of Performance of Constructed Facilities. 24 : 519–528.
14. Hollnagel, E (Ed), Leveson N, Woods D D ( 2006 ). Resilience Engineering : Concepts and Precepts. Pub Ashgate.
15. Wacker J G ( 1998 ) “A definition of theory: research guidelines for different theory-building research methods in operations management ” Journal of operations management 16.4 : 361–385.
Authors
Faculty of Engineering and Information Sciences, University of Wollongong, Australia
University of Wollongong, Wollongong, NSW, AU
Faculty of Engineering and Information Sciences, University of Wollongong, Australia
Citation: L. Robertson, A. M. Aneiros and K. Michael, "A theory of exposure: Measuring technology system end user vulnerabilities," 2017 IEEE International Symposium on Technology and Society (ISTAS), Sydney, NSW, Australia, 2017, pp. 1-10, doi: 10.1109/ISTAS.2017.8319089.