Supply system's technology configuration as a contributor to end-user vulnerability
Citation: L. Robertson, K. Michael and A. M. Aneiros, "Supply system's technology configuration as a contributor to end-user vulnerability," 2015 IEEE International Symposium on Technology and Society (ISTAS), Dublin, Ireland, 2015, pp. 1-6, doi: 10.1109/ISTAS.2015.7439445.
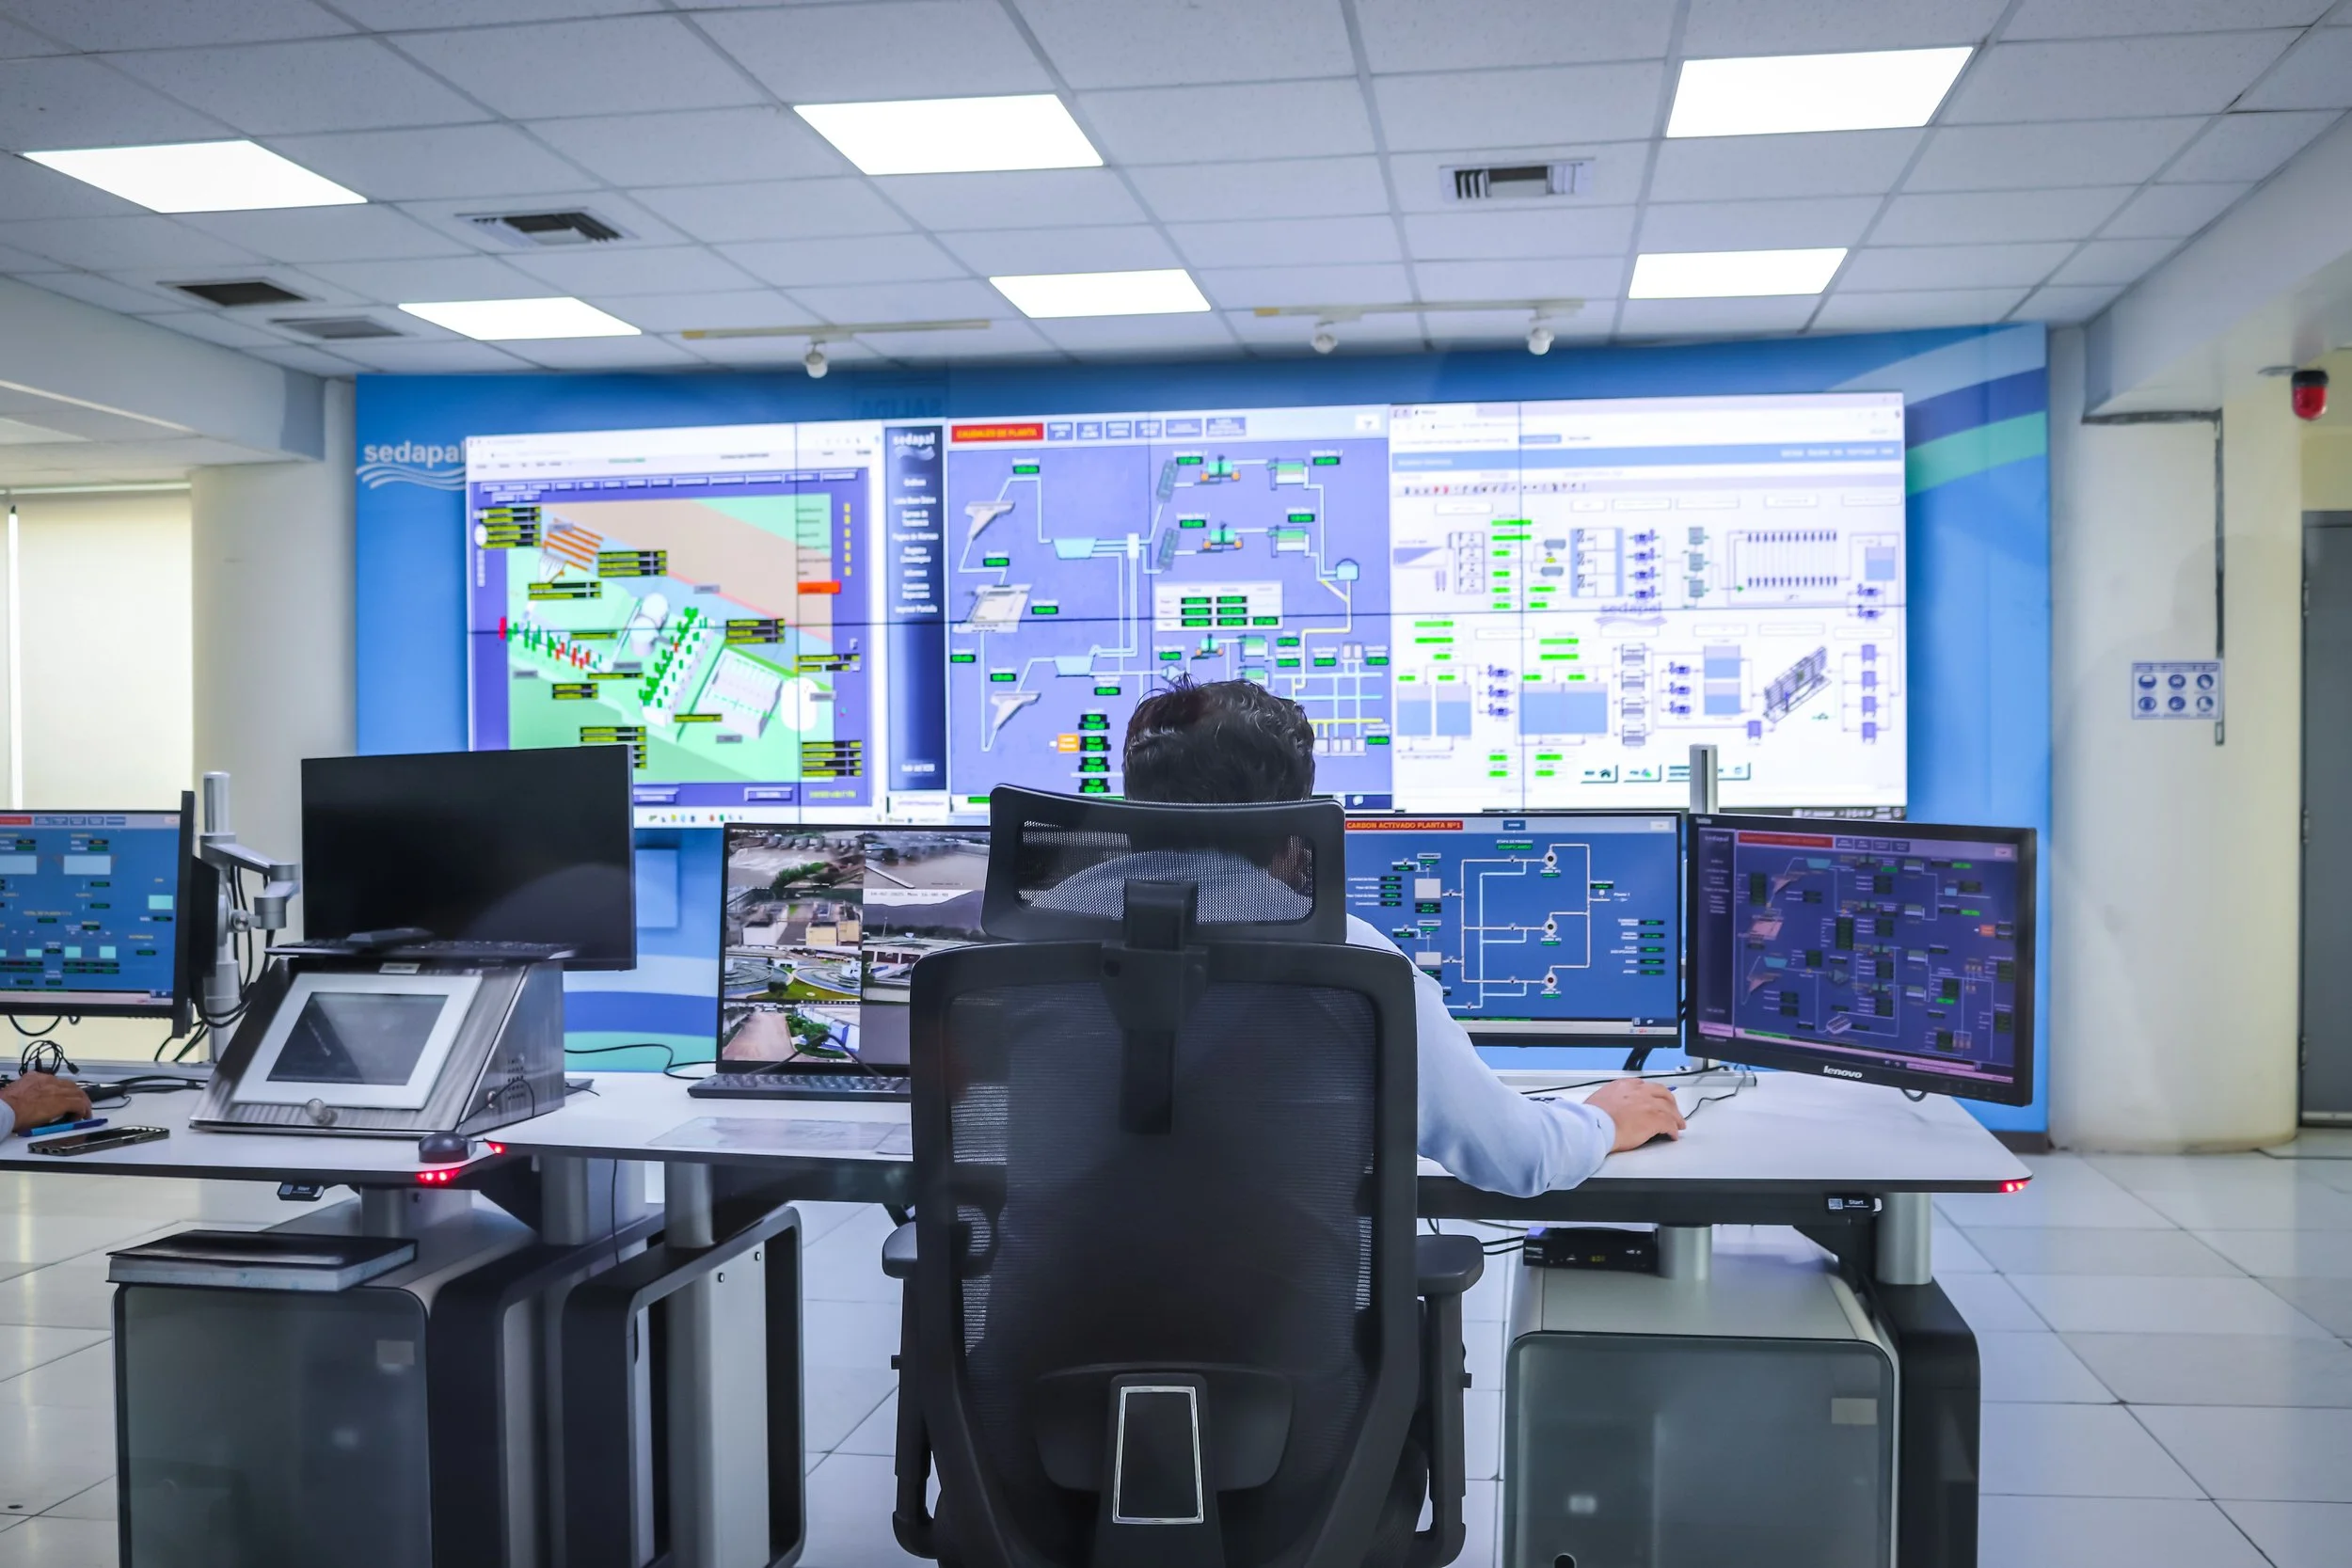
Image by Fernando Narvaez
Abstract
Individuals requiring goods and services essential to their mode of living, are increasingly vulnerable to failures of the complex, interlinked, and inhomogeneous technological systems that supply those needs. Extant analysis techniques do not adequately quantify, from an end-user's perspective, the vulnerability that is contributed by such technological systems. This study explores the significance of inherent weaknesses of inhomogeneous technological systems and proposes an approach for measuring vulnerability as the individual end-user `exposure level' for each service. The measure of "exposure" that is developed, is mapped directly from the configuration of a technological system. This measure of exposure allows quantitative evaluation of existing configurations and proposed improvements to a technological system. The measure can therefore be used to determine which systems currently contribute most exposure to each individual, to identify the causes of that exposure, and to rank mitigation projects' effectiveness.
SECTION I.
Introduction
A. Individual End-User Focus
Today's urban-dwelling individuals are end-users who depend on increasingly large, complex and inhomogeneous technological systems for the provision of essential goods and services. They share a widespread recognition that systems involving many ‘things that can go wrong’ are fragile. Former astronaut and United States Senator John Glenn stated in his retirement speech [5].
“… the question I'm asked the most often is: ‘When you were sitting in that capsule listening to the count-down, how did you feel?’ ‘Well, the answer to that one is easy. I felt exactly how you would feel if you were getting ready to launch and knew you were sitting on top of two million parts -- all built by the lowest bidder on a government contract’.…”
Sen. Glenn's perception of vulnerability was quite well-founded, and most would appreciate that similar concerns apply to more mundane situations than the Mercury mission. The high dependence of end-users justifies the widely observed concern over the vulnerability of the systems that provide them with goods and services.
Sen Glenn's “two million parts” is, or course, a lighthearted simplification: some of the Mercury systems would have had multiple design redundancy, others would have had many dependencies, and some interlinked systems would be likely to be exposed to common-mode failure points; their configuration is more important than just a parts-count!
Much effort and revenue has been expended in attempts to decrease the vulnerability of technological systems in general, however it is proposed that several aspects are yet to be adequately addressed.
Individual end-user vulnerability can be distinguished from the profit/loss concerns of businesses and supply-chain operators, because individual end-users often have no alternative means of acquiring goods and services which are essential to them, and the consequences of failure to the individuals are disproportionate to the consequences to the operator. Moreover, individuals may lack awareness of the length and fragility of the supply chains that deliver these goods and services yet may be expected to be concerned for their own security. Many researchers [3][13], as well as military strategists, have presented a socio-technical perspective on individual vulnerability by drawing attention to the complexity of the supply chains responsible for the provision of essential goods and services.
Infrastructure systems are commonly a major subset of the complete technological systems which deliver goods and services to individual end-users but are distinguishable from them. Contrasting with the opinion of infrastructure owners, the Authors of this paper would argue that infrastructural systems have no inherent value; they only have value to the end-user until another option can supply the goods/services with lower cost, higher reliability and lower vulnerability
B. Technological Systems
1) Inhomogeneous (Heterogeneous)
The technological systems that supply goods or services to end-users involve the progressive transformation and transportation of raw materials, energy, work-in-progress and finished products/services, to end-users. These systems are therefore characteristically “inhomogeneous” or “heterogeneous” and can be clearly distinguished from those “homogeneous” systems which only distribute finished products/services. Although technological systems are often assumed to be homogeneous for reasons of simplicity, the justifications for such a simplification may not be justifiable in many contexts.
2) Interconnected
In addition to being “inhomogeneous”, systems delivering goods and services to end-users are also interconnected: the contribution of interconnectedness to infrastructure system vulnerability has been particularly noted by researchers [2] while other authors [9][16] note that the interconnectedness of infrastructure and ensuing interdependencies cause significant practicality issues for modelling such systems.
Many researchers [11][4][1] not only recognize the high degree of interconnectivity among many infrastructural systems, but also recognize the consequent dangers of treating them too simplistically.
3) Current Analyses Useful but Inadequate
A range of techniques have been applied to the analysis of vulnerabilities, and all of these contribute to the field. It is however proposed that there are aspects of the field which are not yet adequately measured, and for which a valid metric would represent a practical contribution.
4) Indexation to Individual End-User Allows Evaluation of System
As well as being distinguishable in purpose, and a valid cause for concern, the indexation to a single (representative) individual end-user allows the evaluation of the performance and characteristics (i.e. contribution to vulnerability) of a complex system in terms of a single output.
C. Approach
This paper will examine existing techniques used in the general field of risk and vulnerability assessment, assessing their applicability to inhomogeneous system supplying goods and services, and also assessing the aspects in which enhancement is valuable. Contextually, the paper proposes that it is valuable to index an assessment of vulnerability to the delivery or non-delivery of each specific service to an individual end-user. The paper will then consider the importance of the configuration of the (inhomogeneous) technological system used to deliver the goods/service, and specifically the number and characteristics of weaknesses within that system. The aim of this paper is to show how the number and characteristics of the weaknesses of a technological system can be enumerated as a valid, practical and valuable measure of the technological system's contribution to the individual end-user‘s vulnerability, and can therefore be used to target measures to reduction of exposure. The value and contribution of the metric will be discussed.
SECTION II.
Review of Published Analysis Techniques
A number of analysis approaches or techniques have been applied to this or related fields; it is useful to review these and examine the applicability and limitations of each.
A. Network Analysis
Simplifications of computer communication systems, power systems and water distribution systems have commonly assumed system homogeneity, whereby a single product is transmitted across a mesh of identical vertices and edges serving to either aggregate or distribute the product between links.
Researchers [15] have noted that it is possible to represent homogeneous networks using the notations of graph theory. Once a network is represented as a graph, it is possible to mathematically describe the interconnection between specified vertices. The graph theory analysis assumes a homogeneous system and cannot be applied to “inhomogeneous” systems (in which interconnections do not always carry the same goods/services).
B. Resilience Analysis
‘Resilience’ has been the topic of significant research. Much of the literature on this topic is dedicated to the characterization of the concept and definitional consensus. A representative definition [6] is ‘… the ability of the system to withstand a disruption within acceptable degradation parameters and to recover within acceptable losses and time …‘. This definition is interpreted quantitatively as a time-domain response that is either the length of the interval between a disturbance and the re-establishment of a predisturbance state, or in the area under the response curve (i.e. the integration of system response with respect to time): both of these approaches implicitly assume that the disturbance is below an assumed ‘maximum tolerable’ level, and so the technological system will not actually fail.
For complex systems, derivation of time-domain responses to a specific input disturbance can be expected to be difficult, and such a derivation will only be valid for one particular initial operational state. Responses to each possible system input and initial condition would generate a new time-domain response, and so a significant family of response functions would be required in order to fully characterize the ‘resilience’ of a single technological system. This definition therefore carries the inference that resilience is a multi-dimensional state variable of the system [6].
The literature on resilience has largely ignored the end-user perspective as much of the interest is on avoidance of monetary losses to the financier.
C. Risk Analysis
Classical risk analysis [8] includes (explicitly or implicitly) a number of components:
A description of the system involved. Generally such systems are only defined implicitly and seldom with any attempt at definition of specific configuration.
A list, generated by experts, of possible hazards.
A list, generated by experts, of possible harms associated with hazards.
A categorization of each ‘harm’ according to severity
A categorization of the probability of each hazard.
Application of a lookup table, which assigns a risk category (from a small number of options) to each combination of harm and hazard categorization.
The discipline of carrying out a risk analysis is certainly valuable. Despite the ubiquity of risk analysis methods, however, several difficulties can be identified within the list of risk analysis tasks:
Without a detailed definition of the underlying system to which the assessments of hazard and probability are applied, the expert assessments can only be coarse-grained.
The process may fail to identify all of the hazards.
Expert assessment of probability may either inaccurately assess a hazard with a random probability of occurrence, or fail to identify a case where a hazard is guided (non-random).
The ‘probability’ assessment does not take account of the instantaneous state of the system - if the system is close to design load at the instant when a hazard occurs, the probability of the hazard causing harm, is higher than if the hazard occurred at an instant when the system load was low.
The use of categories and lookup tables (e.g. lookup tables which correlates harm and hazard to generate a ‘risk assessment’) is inherently coarse-grained. Changes to system configuration or components may- or may-not trigger a change to the category that is assigned to the risk.
D. Failure Modes and Effects Analysis
Failure Modes and Effects Analysis (FMEA) is a commonly applied engineering technique, which has a different approach to risk analysis: FMEA does require a detailed definition of the technological system under consideration: FMEA systematically considers the failure modes and consequential effects for each component, but is generally applied to relatively simple systems, and importantly it identifies failure modes (e.g. ‘failed open’, ‘failed closed’), as opposed to failure causes (loss of air pressure, loss of power, mechanical breakage etc.) for each component.
E. An Analysis of Relevant Publications
The published approaches to analysis of vulnerability can be categorized according to whether they consider homogeneous or inhomogeneous systems, whether they assume a static or a dynamic system response, and whether system configuration is used as the basis for the development of metrics.
Network analysis is applied to homogeneous systems, assumes a static system but does assess the effect of system configuration.
Risk analysis assumes an inhomogeneous system and a static system but limits analysis to a qualitative assessment of the effect of external hazards.
Resilience analysis assumes inhomogeneous systems, and a dynamic analysis of response to specific external stimulus.
FMEA assumes an inhomogeneous systems and a static analysis, and considers the effect of failure of each separate component of the technological system.
Both resilience analysis (examining each permutation and combination of input, and constraining consideration to input failures) and FMEA analysis (examining fail/go conditions of each component), can generated a tabulated representation of the permutations and combinations of input “fail” criteria that cause system failure. Nevertheless, resilience analysis generates output responses to single inputs, and so does not inherently meet the criterial of completeness, and FMEA is generally used only to demonstrate that a design redundancy requirement of a tightly-defined system is met.
Several other approaches have aspects of interest, and some conceptual overlaps: “Normal Accident Theory” [12] implicitly assumes that given a sufficient timeframe, every hazard will occur - and that (implicitly, assuming sufficient, though undefined, interconnectedness), a system failure will (sooner or later) occur. Other Authors [14] arrive at similar overall conclusions, with more rigor, though within the narrower field of large-scale complex IT systems. Chaos theory [10] conceptually assumes deterministic behavior of a system but considers the cases in which major disturbances of system outputs result from the cascading effects of a minor disturbance. Complexity theory makes yet another approach, and whereas chaos theory assumes an underlying deterministic behavior, complexity theory assumes multiple semiautonomous agents whose actions nevertheless result in partially predictable outcomes. Within complexity theory, rigorous concepts of complexity exist within relatively narrow fields (e.g. number theory) but for other fields definitions are more qualitative.
This paper certainly assumes that all hazards will (sooner or later) occur, and also that consequences might be disproportionate in their effects to the magnitude of the stimulus, however static system (rather than agent-reconfigurable systems) are assumed, and we consider that it is more constructive to attempt to quantify contributions to vulnerability, than to simply conclude that a sufficiently interconnected world will inevitably collapse.
An extrapolation of existing techniques is needed, in order to quantitatively characterize the vulnerability contribution of the system's configuration.
SECTION III.
The Significance of Technological System's Configuration
A. Hazard-Probability of Limited Value
Some hazards (extreme weather events, for example) may be assumed to have probability distribution functions, but not all possible hazards can be assessed statistically.
Terrorism or sabotage in particular, must be considered as intelligently (mis)guided or directed hazards. The effect of a guided hazard upon a risk assessment is qualitatively different from the effect of a random hazard. The guided hazard will occur every time the perpetrator elects to cause the hazard and therefore the hazard must be assessed as having a probability of 1.0.
It is proposed that the significance of this distinction has not been fully appreciated. A malicious entity will actively seek weaknesses, regardless of whether these have been identified by a risk assessment exercise. For intelligently directed hazards (or even for long timeframes), therefore, ‘probability’ is a concept with limited usefulness.
B. Linkage of Hazard to Weakness
It can additionally be observed that events external to a technology system only threaten the output of the technology system when the external events align with a weakness in the technology system. Regardless of the probability of a hazard occurring, if the hazard does not align with a weakness then it is unimportant. Conversely if a weakness actually exists within a technological system and has not been identified, then there will certainly be some un-recognized hazards that can align with the weakness and which therefore represent un-recognized contributions to overall vulnerability.
C. Configuration of a Technological System is Important
It may also be observed that, if the configuration of a particular technology system is changed, weaknesses may be removed while other weaknesses may be added. For each weakness added, an additional set of external events can be re-categorized as hazards - and correspondingly for weaknesses that are removed, the associated external events cease to be hazards.
It has already been noted that the probability of hazard occurrence is of limited value in many cases, and these two observations lead to the conclusion that the rigorous identification of failure modes within a system's configuration is of primary importance in assessing its contribution to an individual end-user‘s vulnerability.
D. Need for a Measure that Derives from Configuration
Efforts to ensure the continued availability of major infrastructural capacities have involved many projects, and consumed significant expenditure. It would be reasonable to question the precision of assessments of the initial “exposure level” of various infrastructures, and the precision of any assessments of the effectiveness of each proposed modification to the configuration and components of the technology system. Such quantitative evaluation is not possible via risk analysis approaches; the graph theory analyses of homogeneous systems are not applicable to complex inhomogeneous systems, and the deprecated significance of ‘hazard probability’ for guided hazards has been previously noted in this paper.
Previous sections of this paper have noted the significance that a technological system's configuration must have in any assessment of that system's contribution to the vulnerability of its end-users, and have argued that the existence of weaknesses is more important than an assessment of the probability of hazards.
It is therefore strongly suggested that there is a need for an approach that derives, only from the configuration of the technology system, a quantitative measure representing the vulnerability contributed by a specific technological system. Such a measure would allow comparison of different technological systems, and would allow evaluation of the effectiveness of changes to the configuration.
SECTION IV.
The Degree of Exposure of a Technological System
A. The Definition of “Service Level” for Delivery of Goods/Services
As a precursor to enumerating the contribution of a technological system to an end-user‘s vulnerability, it is proposed to further refine the definition of ‘harm’ in terms of a failure to achieve a specified service-level for the supply of a nominated service to a representative individual end-user. This definition does not preclude separate analyses for different service levels.
The identification of both a single output variable, and a service-level means that the technological system's output can be represented by a single Boolean variable.
B. Inhomogeneous System Can be Represented with Boolean Algebraic Expression
An inhomogeneous technological system, involves an arbitrary number of interlinked steps, each of which requires inputs (processes and streams) and generates an intermediate product that becomes input to further steps: If the (single) output of such a system is considered to be the delivery or nondelivery of a nominated output to an individual end-user, then an arbitrary inhomogeneous technological system can be described by a system of notional AND/OR/NOT functions whose inputs/outputs include unit-operations, input streams, intermediate product streams, and services.
This approach allows an inhomogeneous technological system of arbitrary complexity, delivering goods/services to a single end-point, to be represented by a construct of logical AND/OR/NOT gates, and evaluated using Boolean algebra.
Having represented the technological system using a Boolean algebraic expression, a ‘truth table’ can be constructed to display all permutations of process- and stream-availabilities as inputs, and technological system output (to end-user), as a single True/False value.
C. Composite Exposure Metric
From such a truth table, it is possible to count the number of cases in which a single input failure will cause output failure, and assign this to the variable “E1”. It is similarly possible to count the number of cases where two input failures (exclusive of inputs whose failure will alone cause system output failure) cause output failure, and assign this value to “E2”. It is furthermore possible to count the number of cases in which three input failures cause output failure (and where neither single nor double input failures within that triple combination would alone cause output failure) and assign this value to the variable “E3” etc. The composite metric {E1, E2, E3 … En} thus derived, is therefore directly mapped from the Boolean representation of the inhomogeneous system and characterizes the number and types of weaknesses of that system.
D. Validity and Value of Proposed Metric
1) Numerical (Scale) Validity
The preceding steps have demonstrated that for a given single output at a defined service level, it is possible to isomorphically map an arbitrary technological system onto a Boolean algebraic expression and that it is possible to create a homomorphic mapping to a composite metric that characterizes the weakness of the system. This metric, which assesses the number of weakness combinations of a technological system, then allows a comparison of technological systems (comparing the exposure levels), and thus can determine which systems have greater “exposure level”. This metric also offers a practical approach to evaluating a proposed change to either the configuration or components of a particular inhomogeneous system.
2) Representational Validity
Definitions of the term “vulnerability” generally have two elements: the knowledge that possible failure modes exist, and the knowledge of practical inability to adequately prevent those modes. The lack of ability to prevent failure modes is likely to be associated with practical issues of physical access to particular loci of potential failure, but is also likely to be associated with an awareness that the multiplicity of such loci and the lack of adequate alternatives. It is proposed that these somewhat intuitive concepts are actually described in quite rigorous logical terms by the Boolean representation of the technological system involved, and since the exposure metric {E1, E2, E3 … En} is “constructed” directly from the representation of the technological system, this approach has a “construct validity” [7].
The representational validity of this metric (to the phenomenon of interest, viz contribution to individual end-user vulnerability) must still be considered, and two justifications are proposed. Firstly, the representation of “exposure” using E1, E2, etc supports and adds rigour to the common engineering “N-1”, N-2” design redundancy concepts. Secondly, the cost of “protecting” a system can be assumed to be at least generally related to the number of weaknesses (failure combinations) that exist, and so a measure of these will support decisions on relative merits of alternative projects - a previously-identified criterion for a valid metric. Measures of absolute or relative “complexity” of a technological system do not offer such a provable validity, nor the same level of usefulness for evaluating proposed changes.
E. Integration of Exposure Concept with Risk Analysis Technique
The ‘exposure level’ of a technological system is not proposed as a replacement for ‘risk analysis', but as an additional technique that is not only intrinsically valuable, but offers the option of increased the rigour of risk analysis. A definition of the technological system (and associated exposure level) allows a more rigorous process for identification of hazards and their linkage to specific system weaknesses.
SECTION V.
Illustrative Example
A highly simplified example based on the delivery of petrol to a consumer's vehicle, will illustrate the proposed approach
The scope includes the operation of the dispensing pumps, the fuel storage tanks, and the metering and transactional services. Although the station's storage is significant, the refilling of the underground tanks from fuel stored in national-reserves can only be accomplished by a limited number of approaches, which must occur frequently within the considered timeframe and so must be considered. The station is unlikely to have duplicated power feeders from the nearest substation and so this supply must be considered. The local substation will probably have at least dual in-feeds from the national grid and so there is no need to consider power supply security further back than it. Only a single communications system is likely between the station and the nearest ISP and so this link must be considered. The financial system (EFTPOS clearinghouse) is operated at a national level and so must be included in the consideration. On the assumption that the station is manned, staff facilities (such as sewage and water supply) are also required.
Operationally, petrol pumps will operate if fuel and electric power to operate the pumps are both available. The purchase transaction will be possible if the fuel can be metered and a local control and data collection system (transmit the amount pumped to the cashier) is functional and a skilled operator is available and an external communications system is functional and a coupled operational financial transaction system is available and operational. The fuel metering will be possible if the meter is functional and power is available. The external communications system will operate if the last-mile hardware (phone line) is available and a power supply is available. The financial transaction system will be available if the communications to the national financial clearing house is available and the clearinghouse is operational. Since the station is not automated, the availability of a skilled operator is only practical if an operational water supply and an operational sewage disposal system and power for lighting and security is available.
Such a “pseudocode” description can be easily translated into a Boolean expression from which a truth table can be constructed.
The truth table for this case would be likely to show several single sources of failure (contributors to E1 value), including the power supply to the pumps (including the cabling to the closest substation), the pump itself and the metering system, the operator, and station facilities. Provided the operator will accept cash or paper-credit notes, then the payment system contributes to the E2 value, however if the operator is constrained to electronic payments then processes associated with the communications and banking systems will contribute to the E1 value. These principles can be applied throughout the example, and one could (for example) observe the effect on the “E1” value if the petrol-dispensing pump had the facility for hand-cranking and mechanical measurement of delivered volume as well as electrical-pulse-based measurement.
SECTION VI.
Discussion and Conclusions
A. Discussion
The dependence of individual end-users upon complex technological systems has certainly increased over the sweep of recent history, and even basic essentials of a modern urban lifestyle are increasingly vulnerable to the disruption of such systems. The general significance of this issue has been at least partially recognized by government and engineering entities, and by the major financial and engineering efforts expended on attempts to decrease critical infrastructure “vulnerability”.
There is general recognition among researchers that even current levels of complexity and interconnectedness make analytical modelling of dynamic responses of complex systems difficult, if not impossible in a practical sense.
The discipline of risk analysis has certainly contributed to the assessment of inhomogeneous systems, but for many situations it may not be adequate. Neither the existing professional approaches to risk management, nor the currently available theoretical approaches have provided sufficiently robust tools to quantify the extant vulnerability/exposure of a particular inhomogeneous technological system (allowing prioritization of infrastructures requiring effort to reduce vulnerability/exposure) or the benefits of proposed reconfigurations.
The proposed analysis method depends on good definitions to ensure that the granularity of system components is treated consistently. The mathematics for evaluating the exposure of contributory systems has been defined, but implementation is likely to need refinement.
It might be observed that an unexpected contributor to the E1 value can be considered to be an instance of a ‘normal accident theory’ contributor. A large value of E1 would also certainly indicate a system prone to failure, and it may also be observed that if a system is described by a Boolean expression, there will always be some combination of input failures that cause system failure - and hence the analysis developed in this paper can be shown to complement “normal accident theory” and chaos theory - yet adds value by enumerating the system characteristics.
B. Conclusions
This study has considered cases in which a complex technological system is supplying goods/services to an individual end-user. For such cases, it is proposed that the number of critical weakness-combinations (exposure level) in the technological system is the most important factor in determining the contribution of that technological system to the individual end-user‘s vulnerability.
The proposed representation of a complex inhomogeneous system using Boolean algebra, allows derivation of the total exposure level, from the full set of “fail conditions”. This paper argues that this is a direct measure of the “exposure level” of the inhomogeneous (and complex) technological system. The measure of “exposure level” is solely characteristic of the configuration and components of the technological system (without regard to probabilities of any particular hazard), and so allows an assessment of contribution to vulnerability which:
is particularly relevant to an individual end-user
is relevant even when hazards are likely to arise from malicious intent rather than from random events
Allows the highly intuitive perceptions of vulnerability/exposure to be evaluated rigorously and quantified with a measure that is demonstrably relevant.
allows comparison of the “exposure” of the end-user‘s various life needs, and thus draws attention to those having higher “exposure levels”
allows the identification of points of exposure that affect multiple life-needs
allows an assessment to be made, of the relative effectiveness of measures that are proposed in the hope of decreasing individual end-user vulnerability.
It is proposed that, since many hazards can be assumed to be intelligently directed (as opposed to random), the “exposure level” of a technological system is the most significant (in terms of end-user supply security) measure of the technological system's vulnerability.
The measure of the degree of exposure (exposure level) of a technological system is rigorously defined and allows a quantitative assessment of the differences between technology systems, and of the effect of proposed improvements. The analysis of system “exposure” also integrates with risk analysis approaches, and increases the rigor of risk analysis by ensuring that all possible hazard-targets are identified and available for consideration.
C. Future Work
Work is ongoing to develop the topics set out in this paper: in particular to:
Further refine the process concepts
Define and analyze a selection of example cases to illustrate the range of exposure values obtained and the options for exposure reductions
Carry out more detailed comparisons between the approach proposed in this paper, and other approaches (e.g. risk analysis) to illustrate the additional insights to be gained.
References
1. SAS Output. [Online]. Available: www.texasschoolaccountabilitydashboard.org/state.html. Accessed: Apr. 6, 2021.
2. California School Dashboard (California Department of Education). [Online]. Available: www.caschooldashboard.org/reports/37683380000000/2019. Accessed: Apr. 6, 2021.
3. Crooks, R. (2017). "Representationalism at work: Dashboards and data analytics in urban education." Educational Media International, 54(4), 289–303.
4. Sarikaya, A., Correll, M., Bartram, L., Tory, M., & Fisher, D. (2019). "What do we talk about when we talk about dashboards?" IEEE Transactions on Visualization and Computer Graphics, 25(1), 682–692. https://doi.org/10.1109/TVCG.2018.2864903
5. "Data Dashboards: Definition, Design Ideas, Plus 3 Examples." Klipfolio. [Online]. Available: www.klipfolio.com/resources/articles/what-is-data-dashboard. Accessed: Apr. 6, 2021.
6. "What Are Dashboards and Dashboarding?" Logi Analytics, Jan. 3, 2019. [Online]. Available: www.logianalytics.com/resources/bi-encyclopedia/dashboards-dashboarding/. Accessed: Apr. 7, 2021.
7. Denwattana, N., & Saengsai, A. (2016). "A framework of Thailand higher education dashboard system." In 2016 International Computer Science and Engineering Conference (ICSEC) (pp. 1–6).
8. Hough, H., & Kirst, M. W. (2017). "California's dashboard data will guide improvement." Education Next, 17(1). Available: www.educationnext.org/californias-dashboard-data-will-guide-improvement-forum-hough-kirst-accountability/. Accessed: Apr. 7, 2021.
9. Humphrey, D. C., & O'Day, J. (2019). The Early Implementation of California's System of Support: Counties, Differentiated Assistance, and the New School Dashboard. ERIC Clearinghouse.
10. McCoy, C., & Rosenbaum, H. (2019). "Uncovering unintended and shadow practices of users of decision support system dashboards in higher education institutions." Journal of the Association for Information Science and Technology, 70(4), 370–384. https://doi.org/10.1002/asi.24131
11. Munzner, T. (2009). "A nested model for visualization design and validation." IEEE Transactions on Visualization and Computer Graphics, 15(6), 921–928. https://doi.org/10.1109/TVCG.2009.111
12. Sedlmair, M., Meyer, M., & Munzner, T. (2012). "Design study methodology: Reflections from the trenches and the stacks." IEEE Transactions on Visualization and Computer Graphics, 18(12), 2431–2440. https://doi.org/10.1109/TVCG.2012.213
13. Do, H. H., & Finkenbinder, K. (2013). A Reference Guide for Interpreting Statistics and Creating Survey Questions. Carlisle, PA: Peacekeeping and Stability Operations Institute, U.S. Army War College.
14. Jenny, B., & Kelso, N. V. (2007). "Color design for the color vision impaired." Cartographic Perspectives, 58, 61–67. https://doi.org/10.14714/CP58.270
15. Colyar, J. (2020). "Constructing a visualization dashboard to improve educational standards in Arizona legislative districts" (presentation abstract). In K. Michael & R. Abbas (Eds.), 2020 International Symposium on Technology and Society (ISTAS): Public Interest Technology, Phoenix, AZ. ISBN 978-981-18-0529-5.
16. Few, S. (2017). "There's Nothing Mere About Semantics." Perceptual Edge (blog). Available: www.perceptualedge.com/blog/?p=2793
Authors
University of Wollongong, Australia
University of Wollongong, Australia
University of Wollongong, Australia
Citation: L. Robertson, K. Michael and A. M. Aneiros, "Supply system's technology configuration as a contributor to end-user vulnerability," 2015 IEEE International Symposium on Technology and Society (ISTAS), Dublin, Ireland, 2015, pp. 1-6, doi: 10.1109/ISTAS.2015.7439445.